
Data Studies
Real numbers from thousands of short-term rentals. No opinions, just what the data shows.
Operations
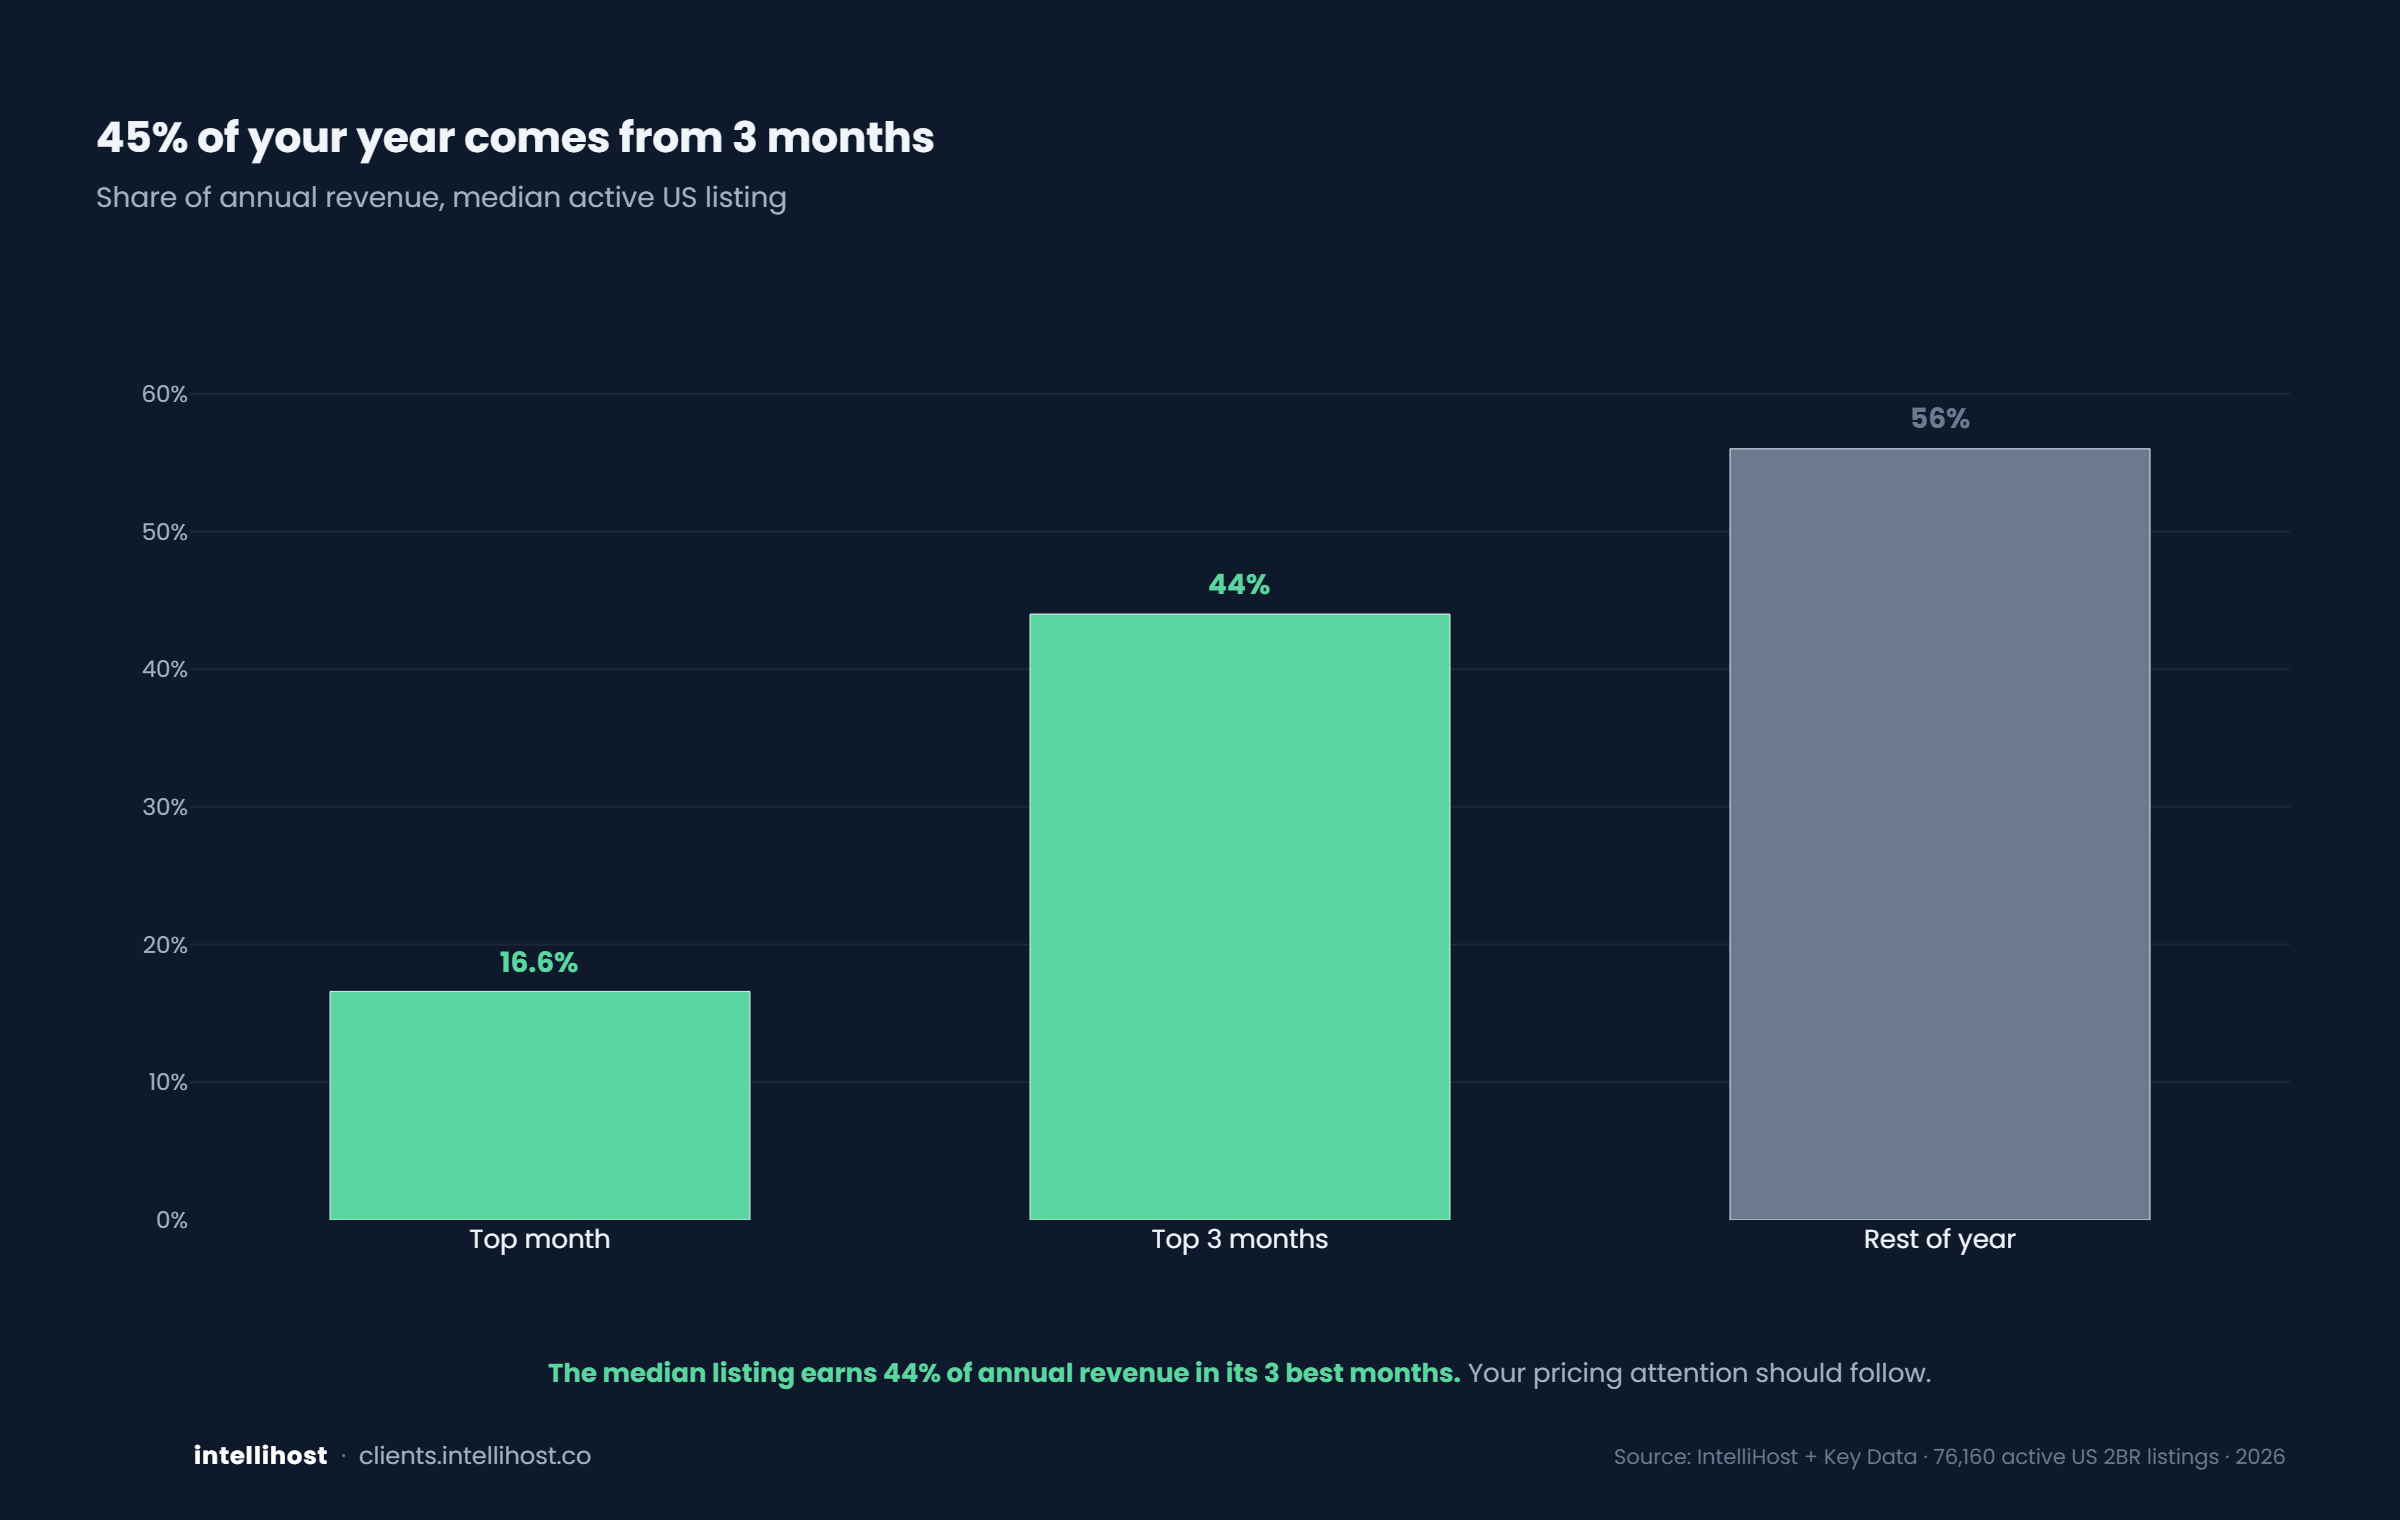
45% of your year comes from 3 months
Your pricing attention should follow.
Listing craft
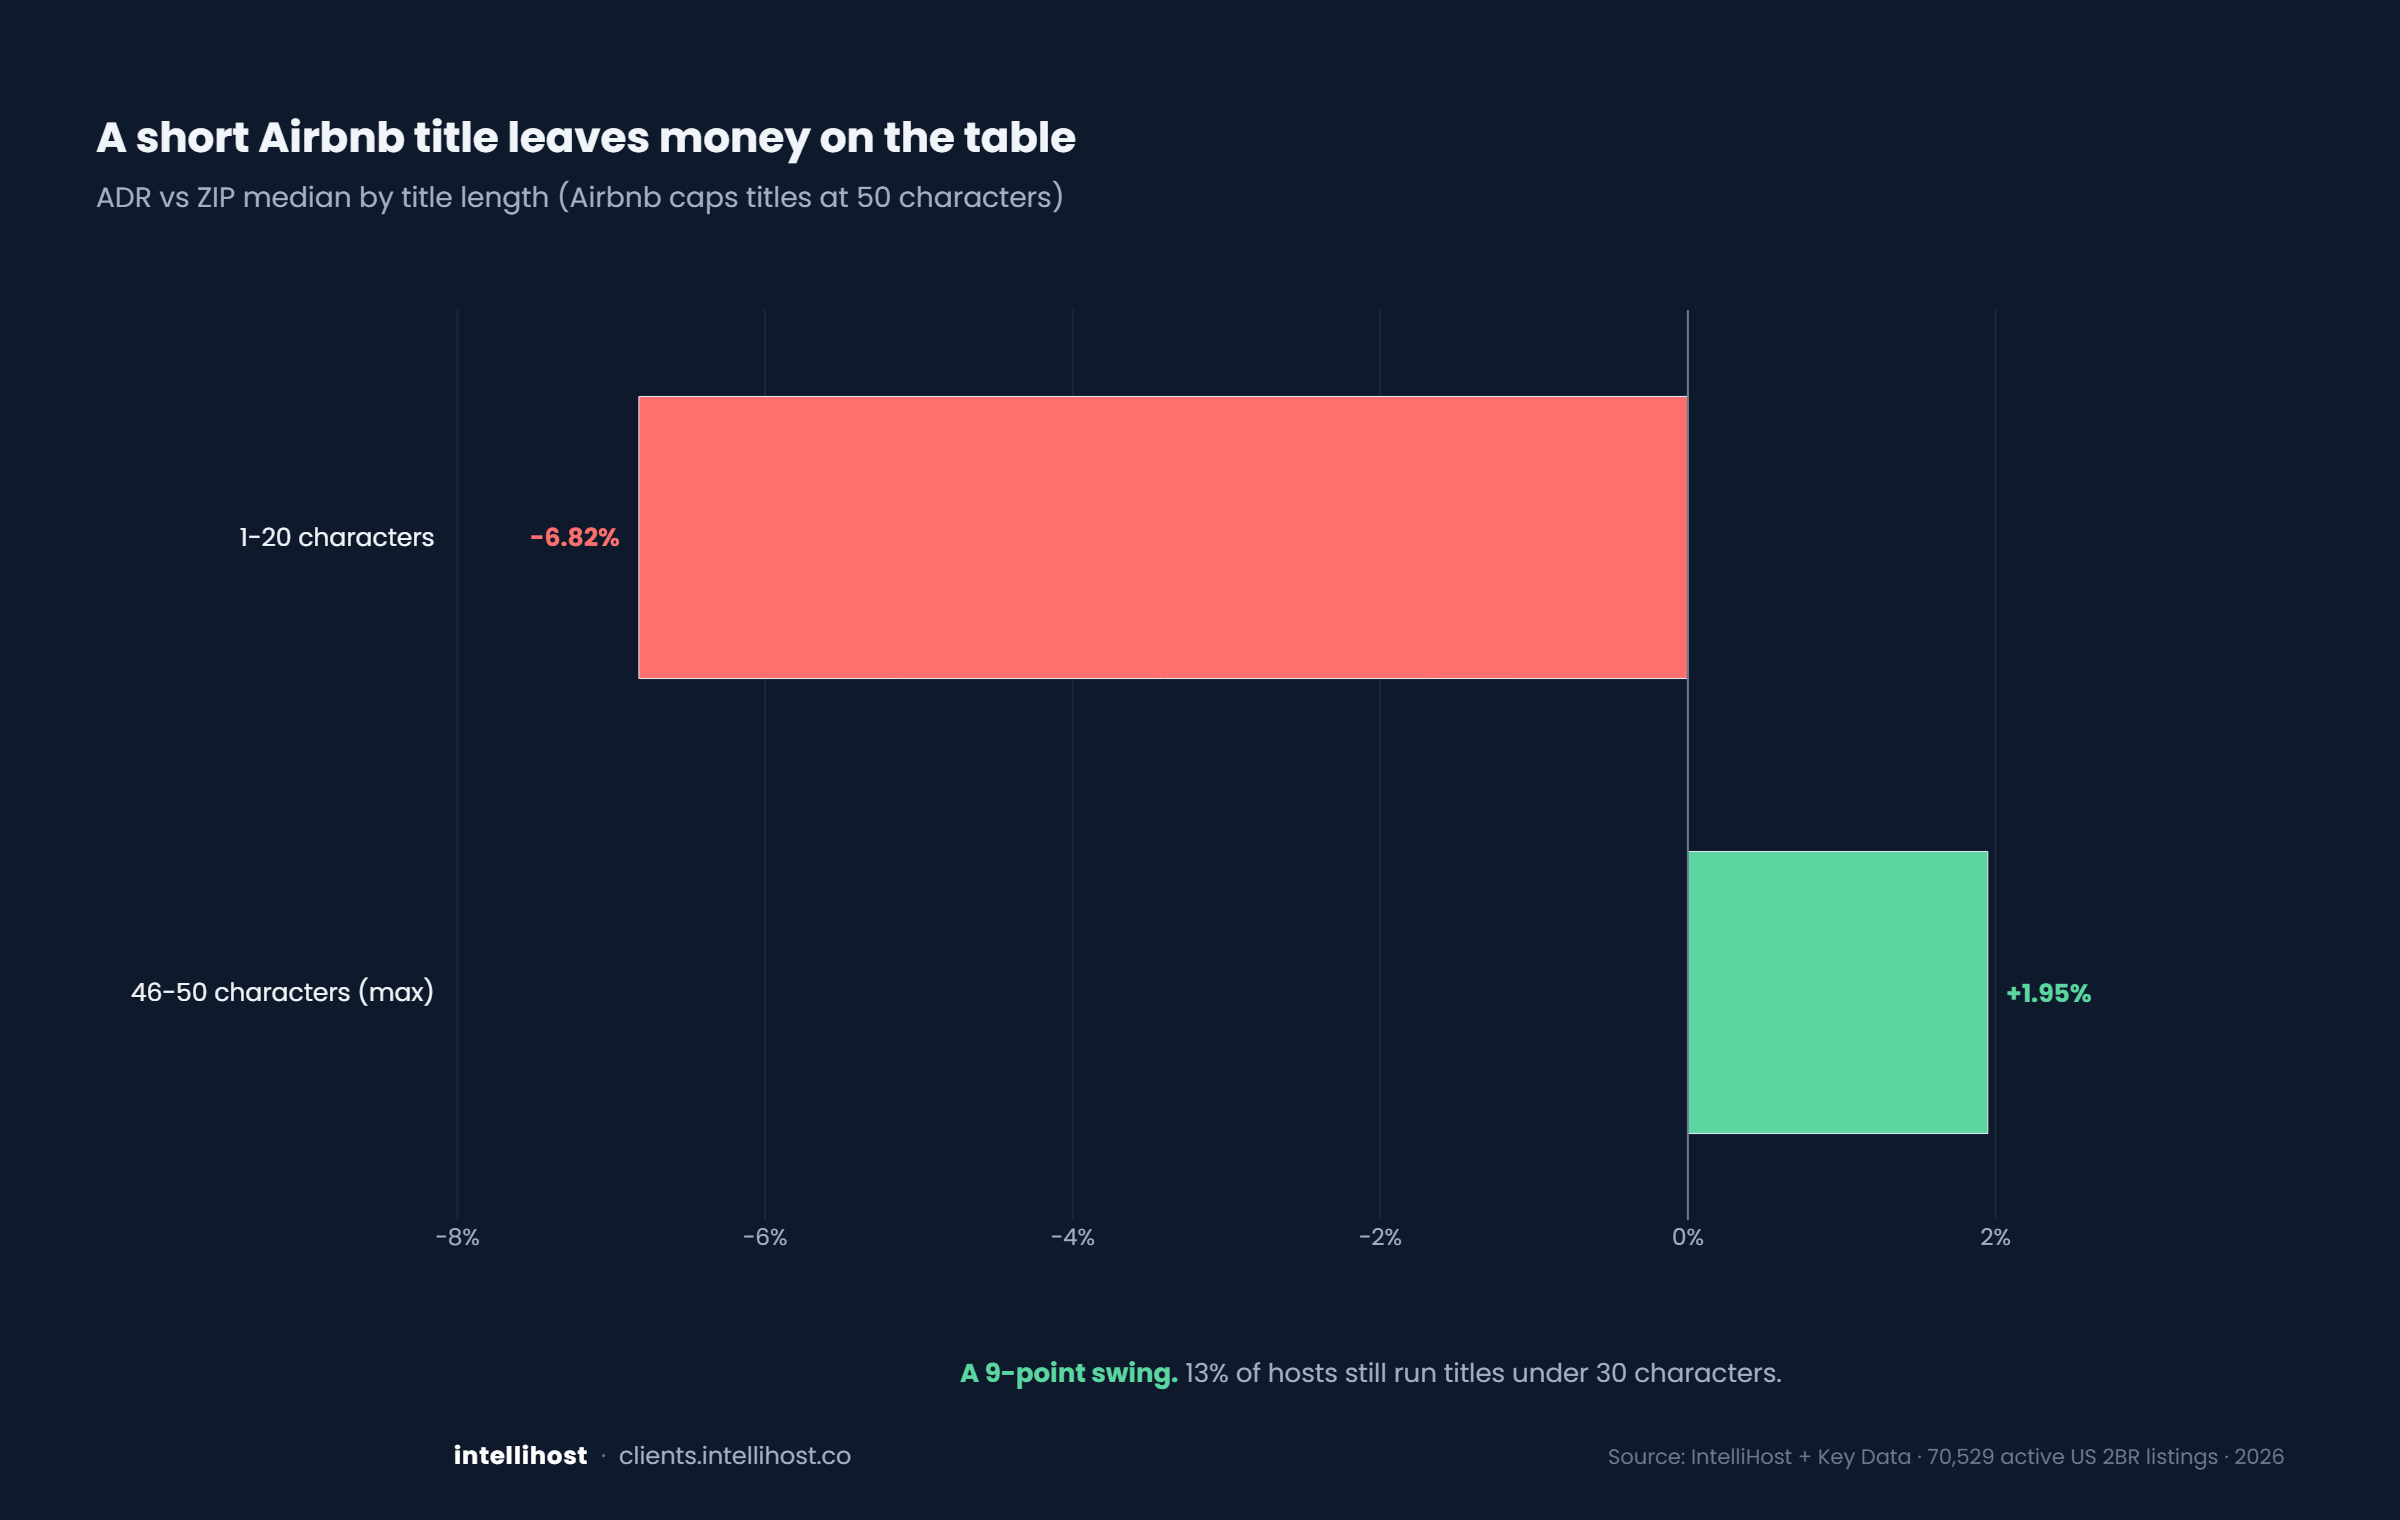
A short Airbnb title leaves money on the table
Under 30 characters is a mistake.
Market
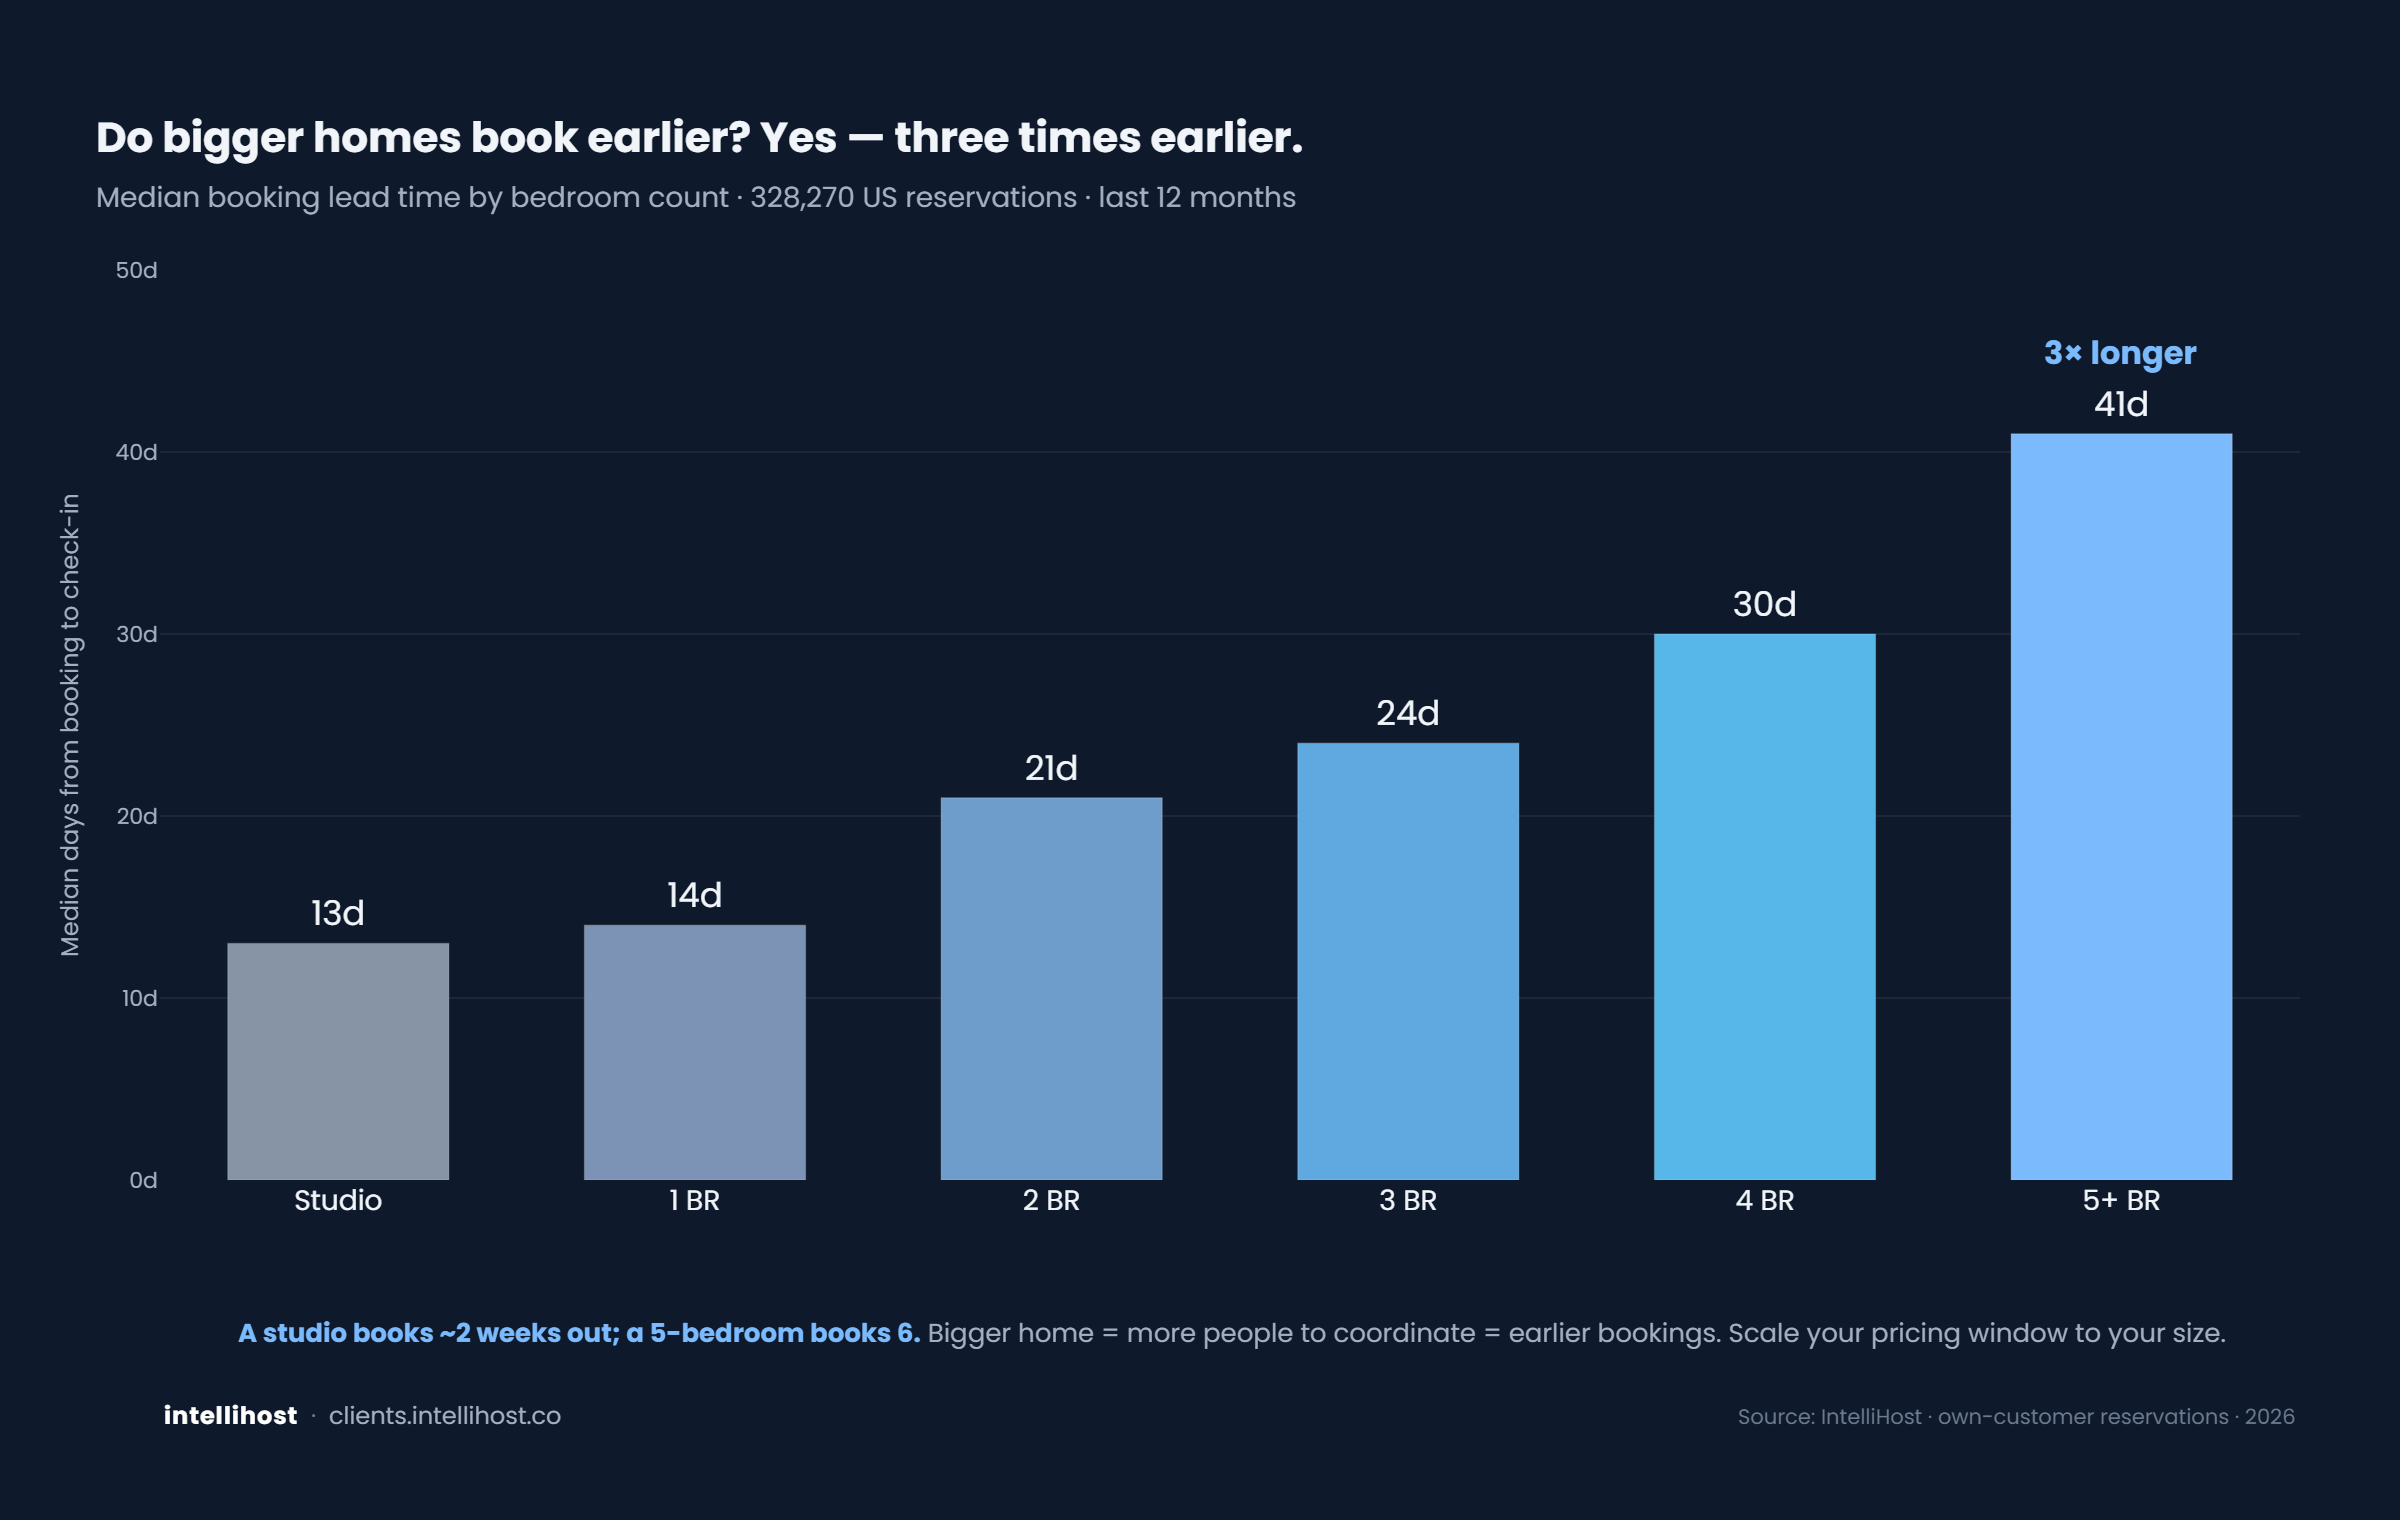
A studio and a 5-bedroom aren't the same business
It starts with when guests book.
Market
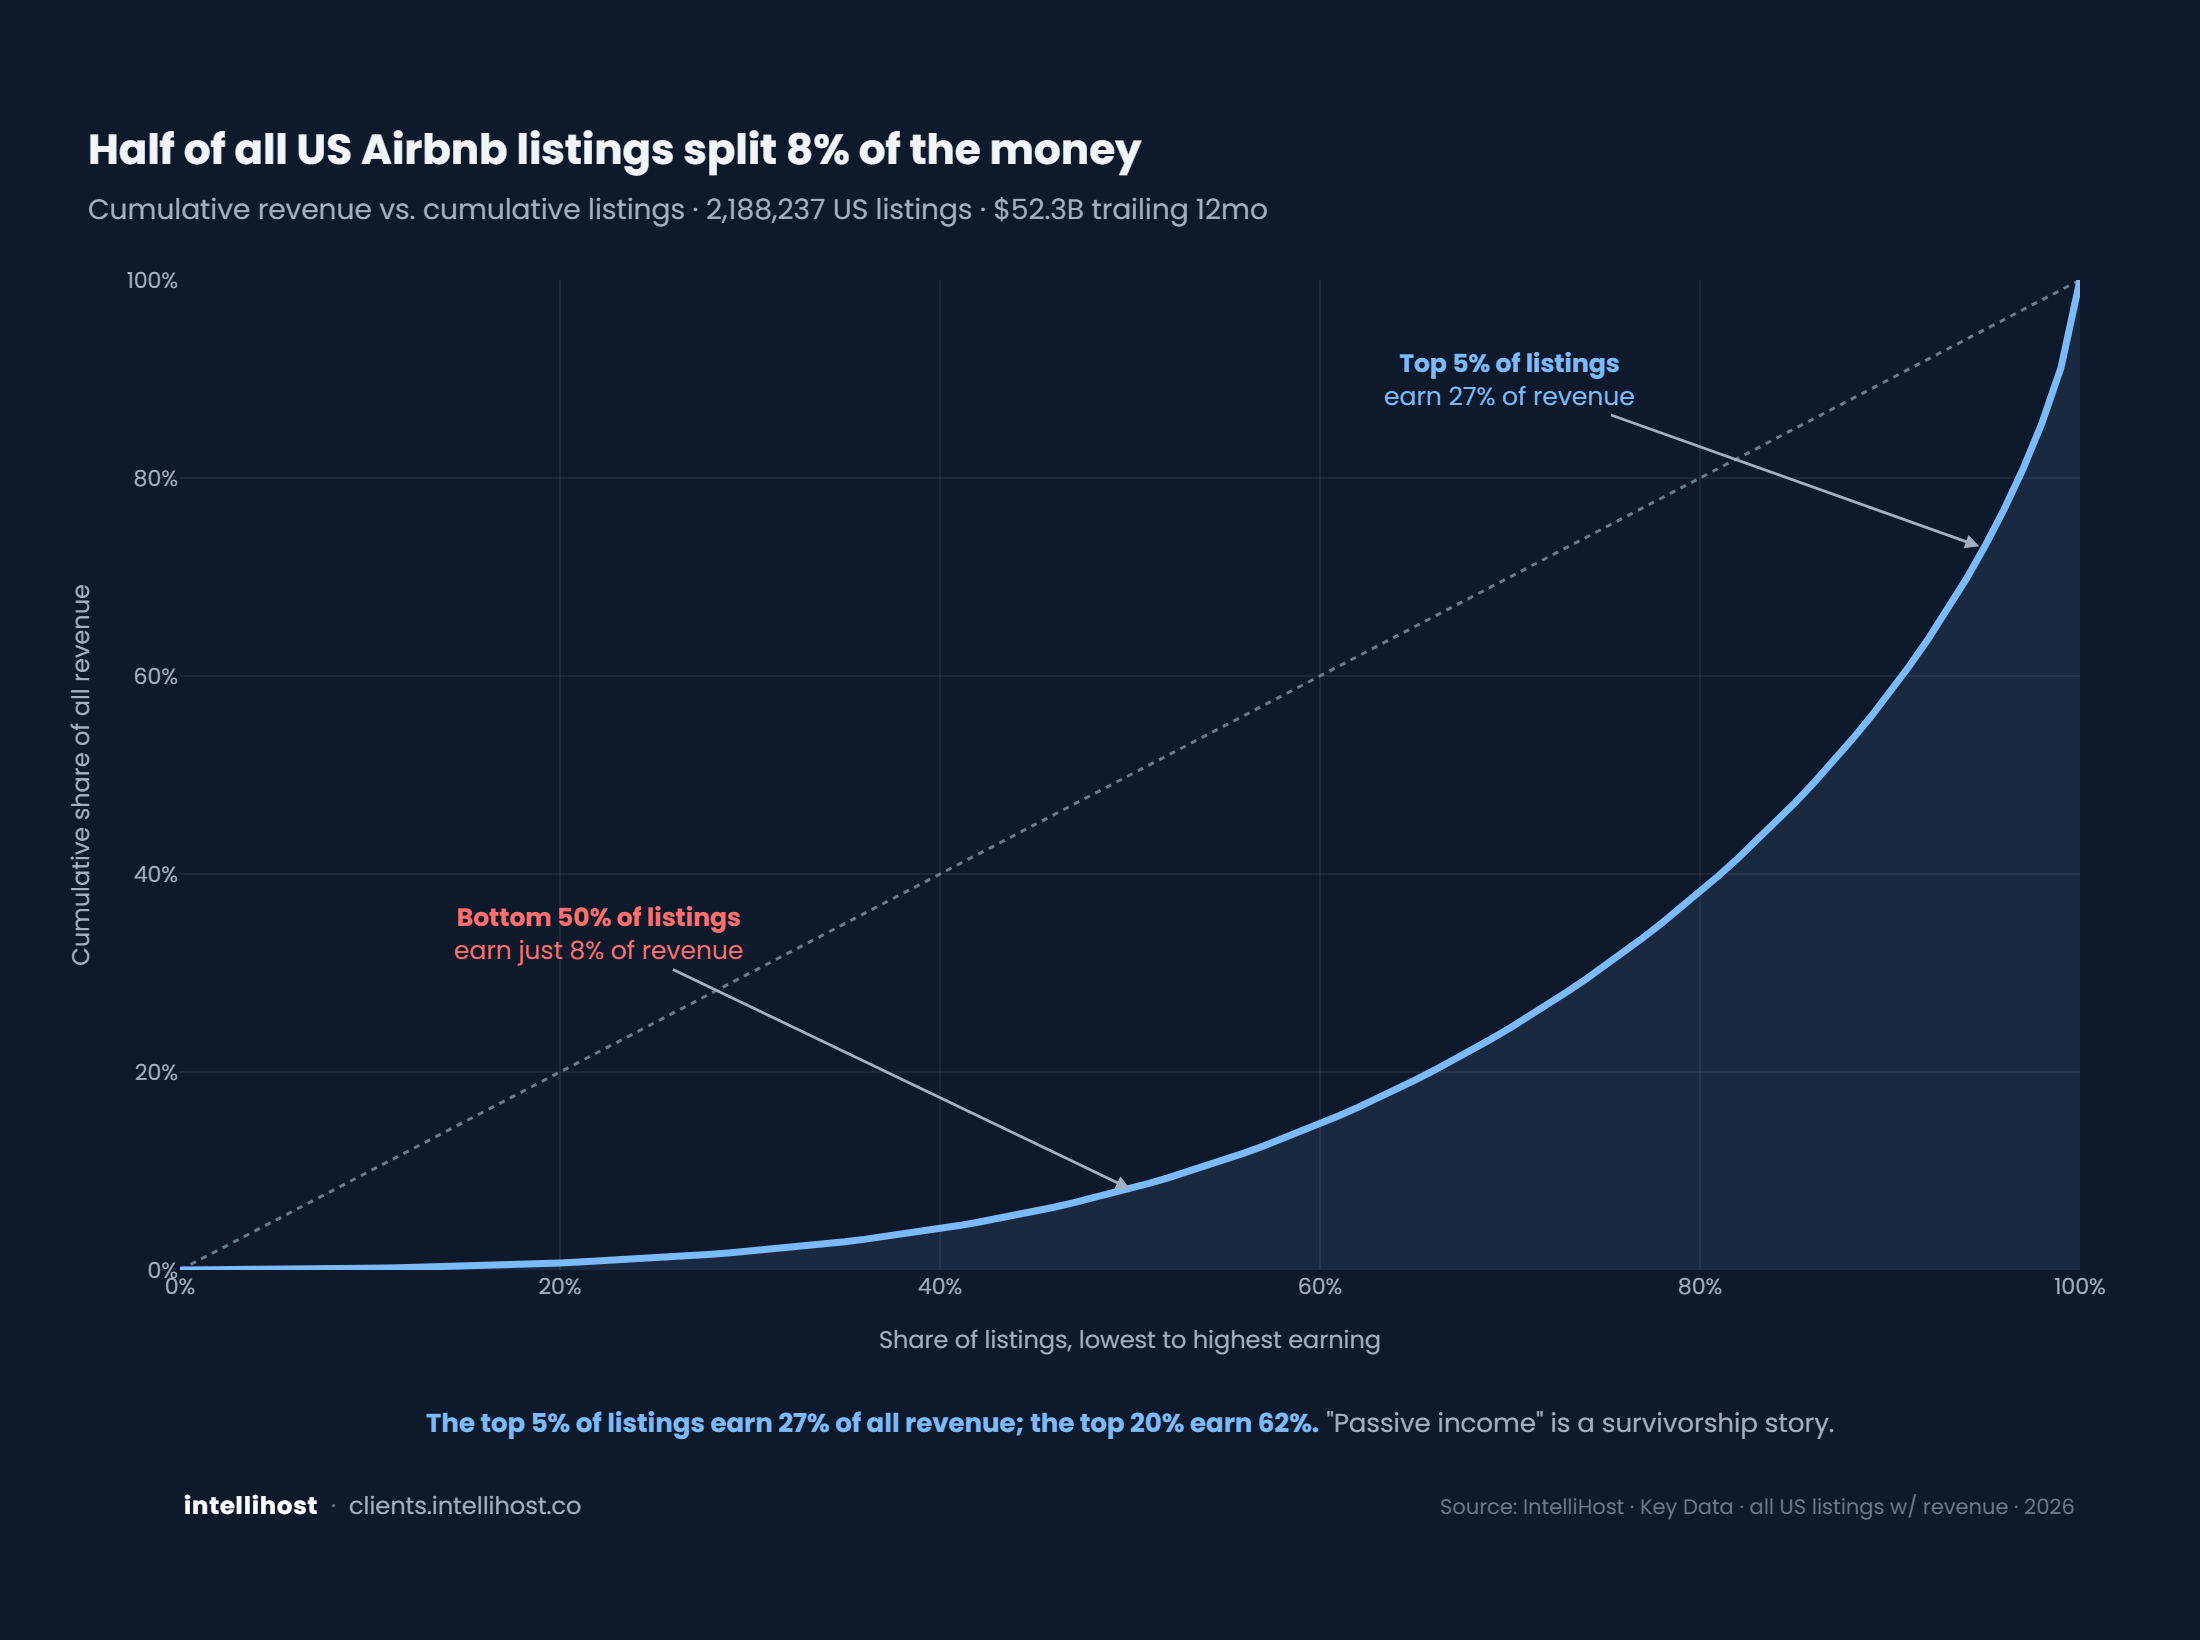
Airbnb is barely passive income
For most listings, the data is brutal.
Listing craft
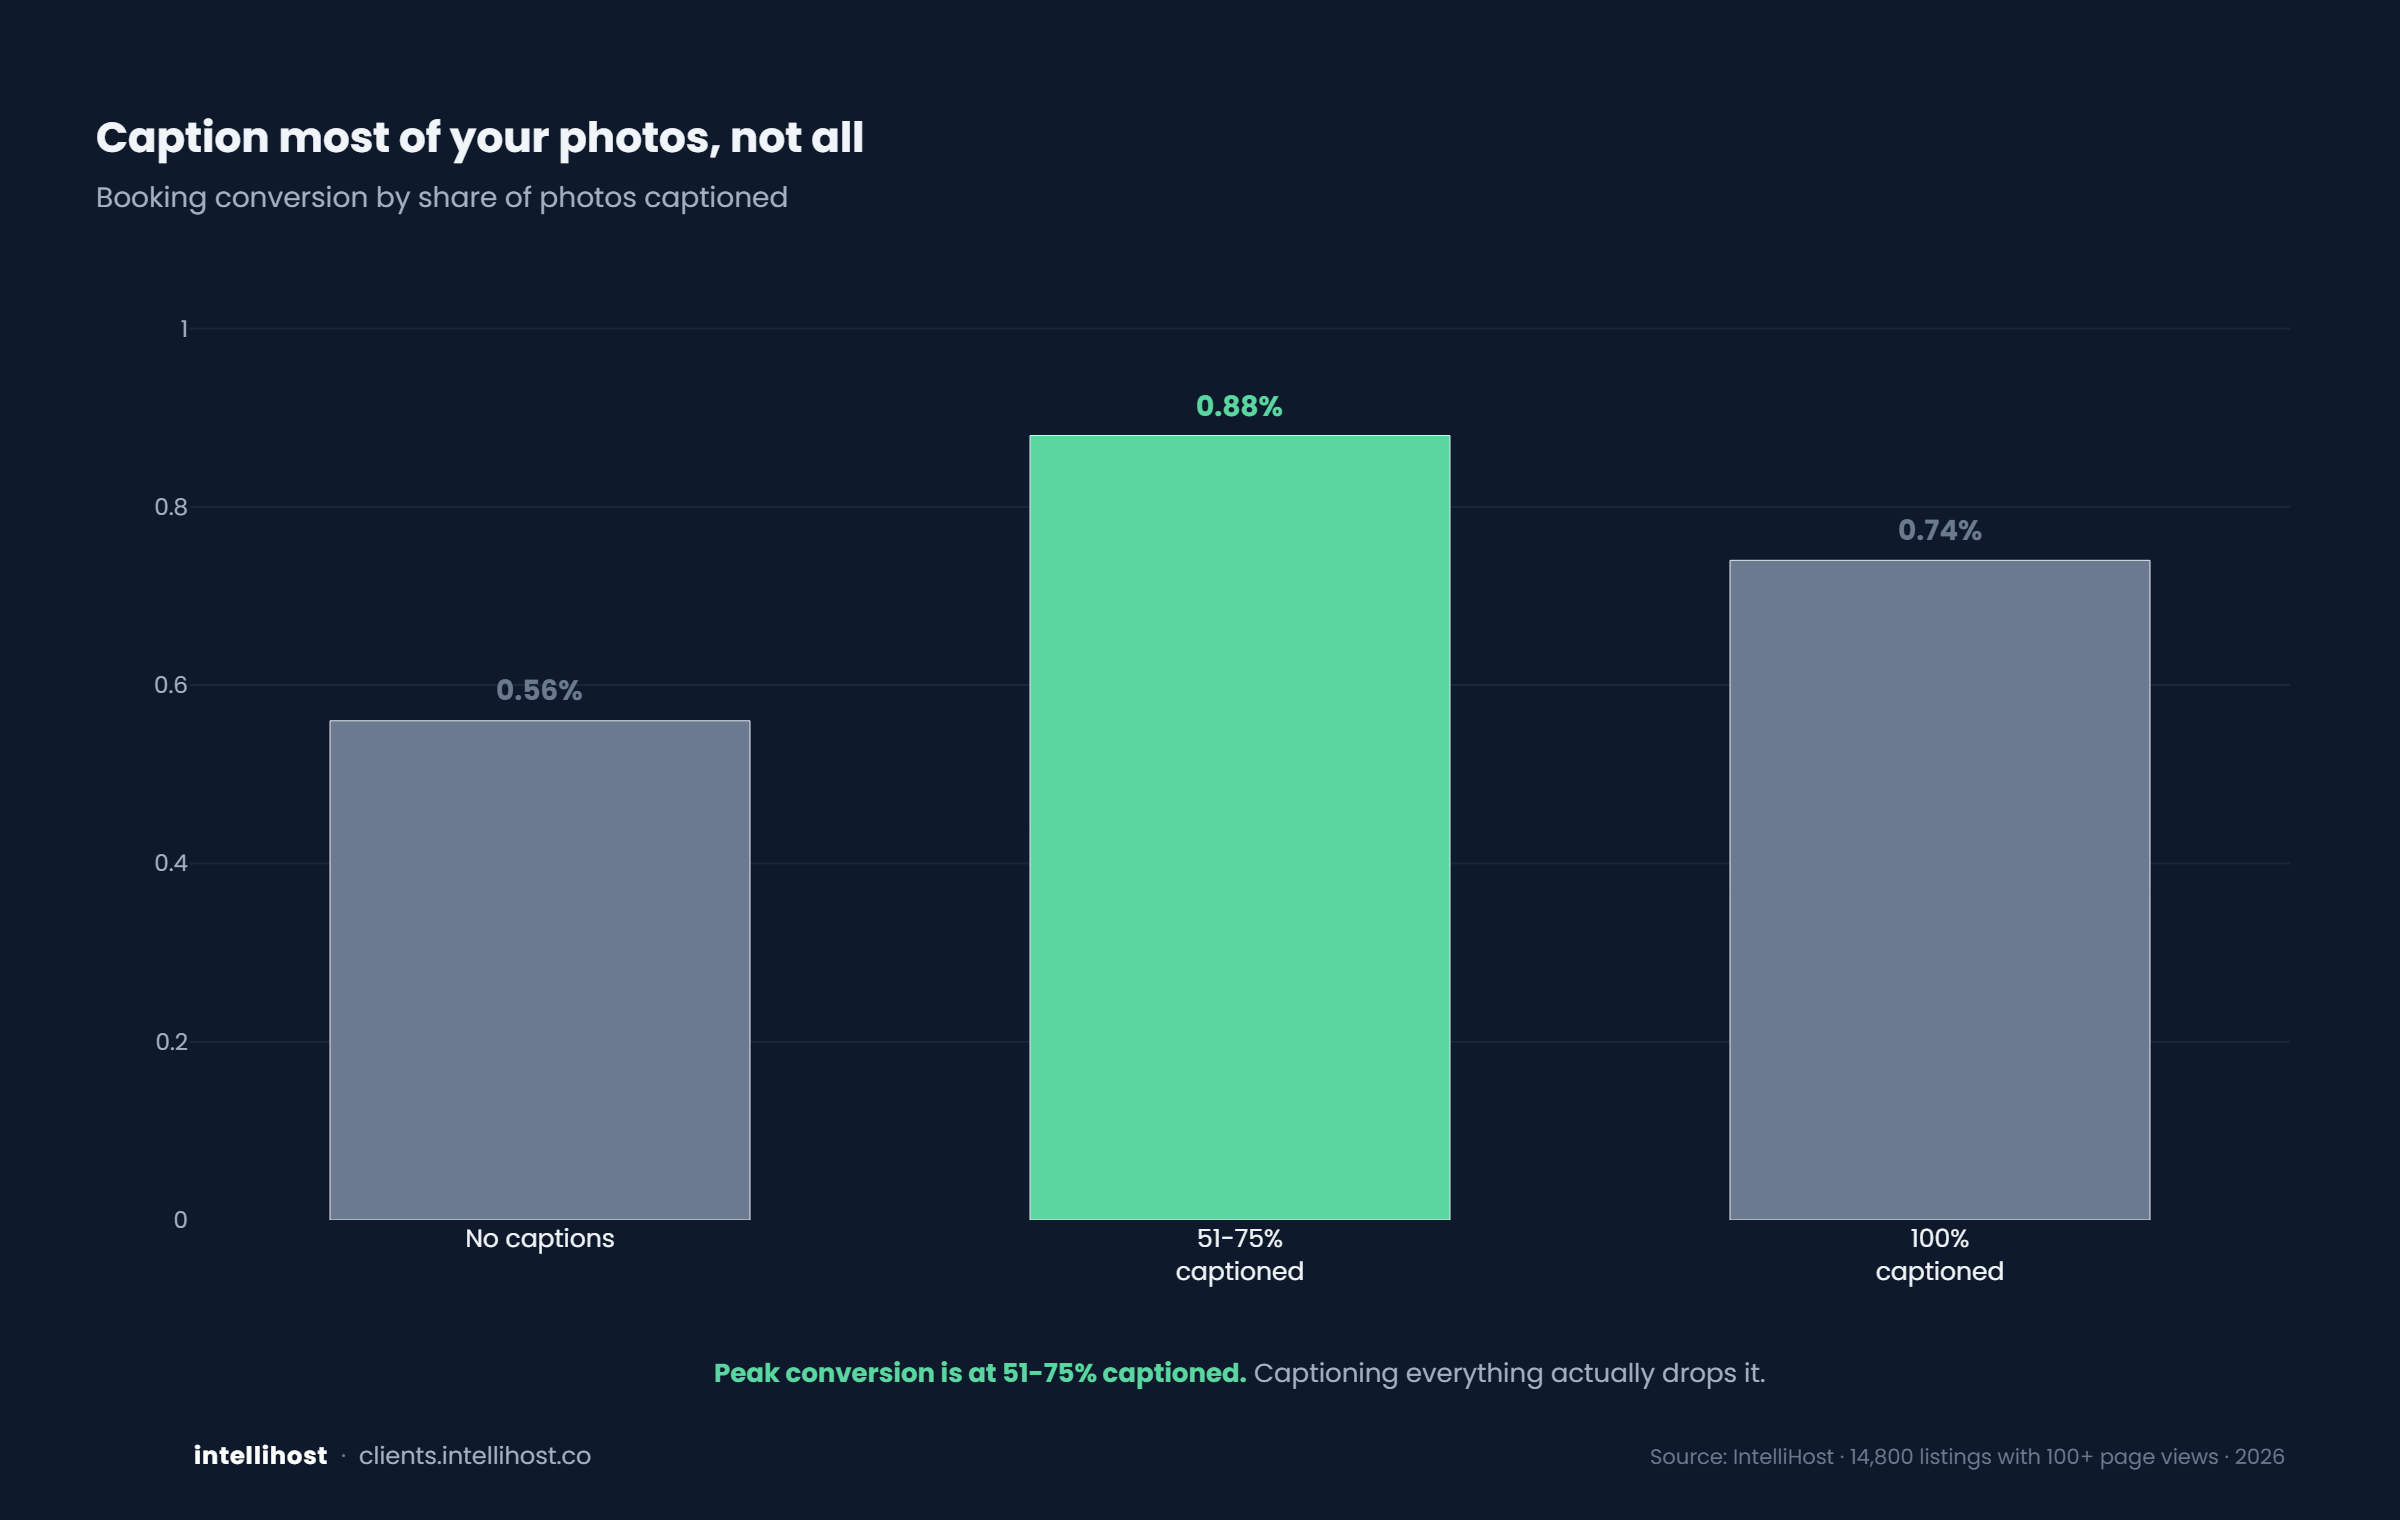
Caption most of your photos, not all
There is a peak, and it isn't 100%.
Pricing
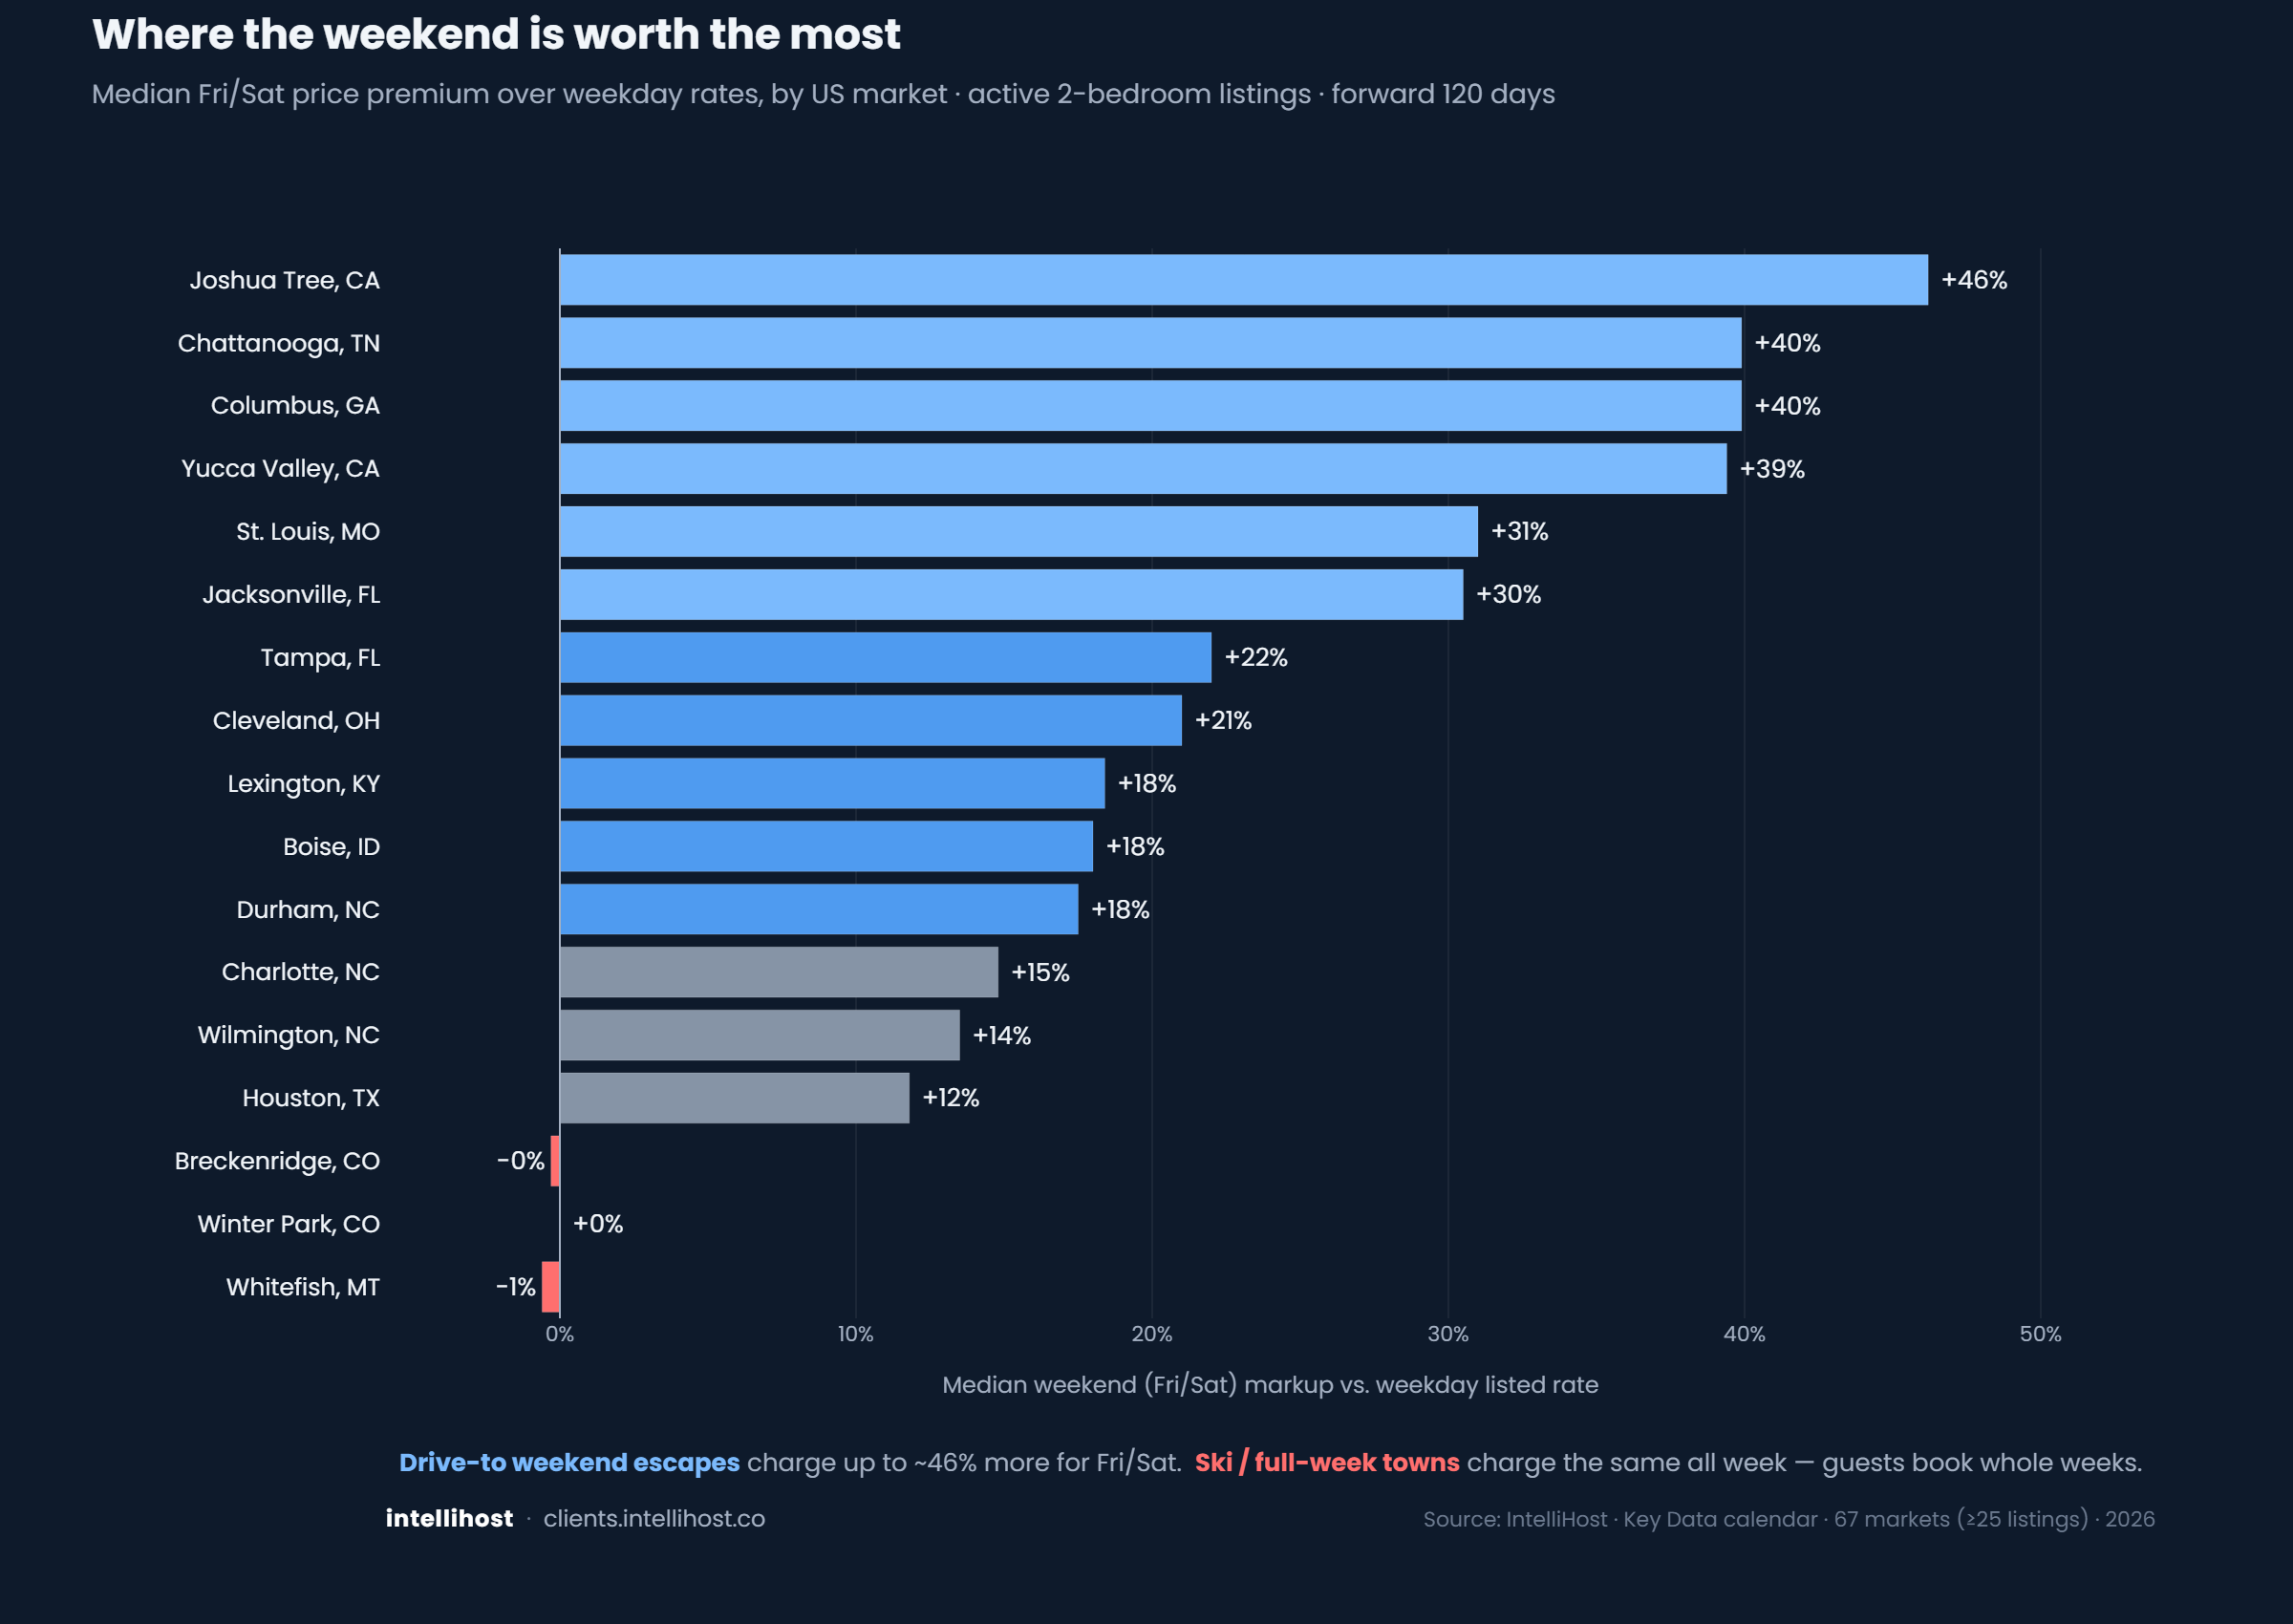
Charge more on weekends is wrong half the time
The weekend premium is a market trait.
Reviews
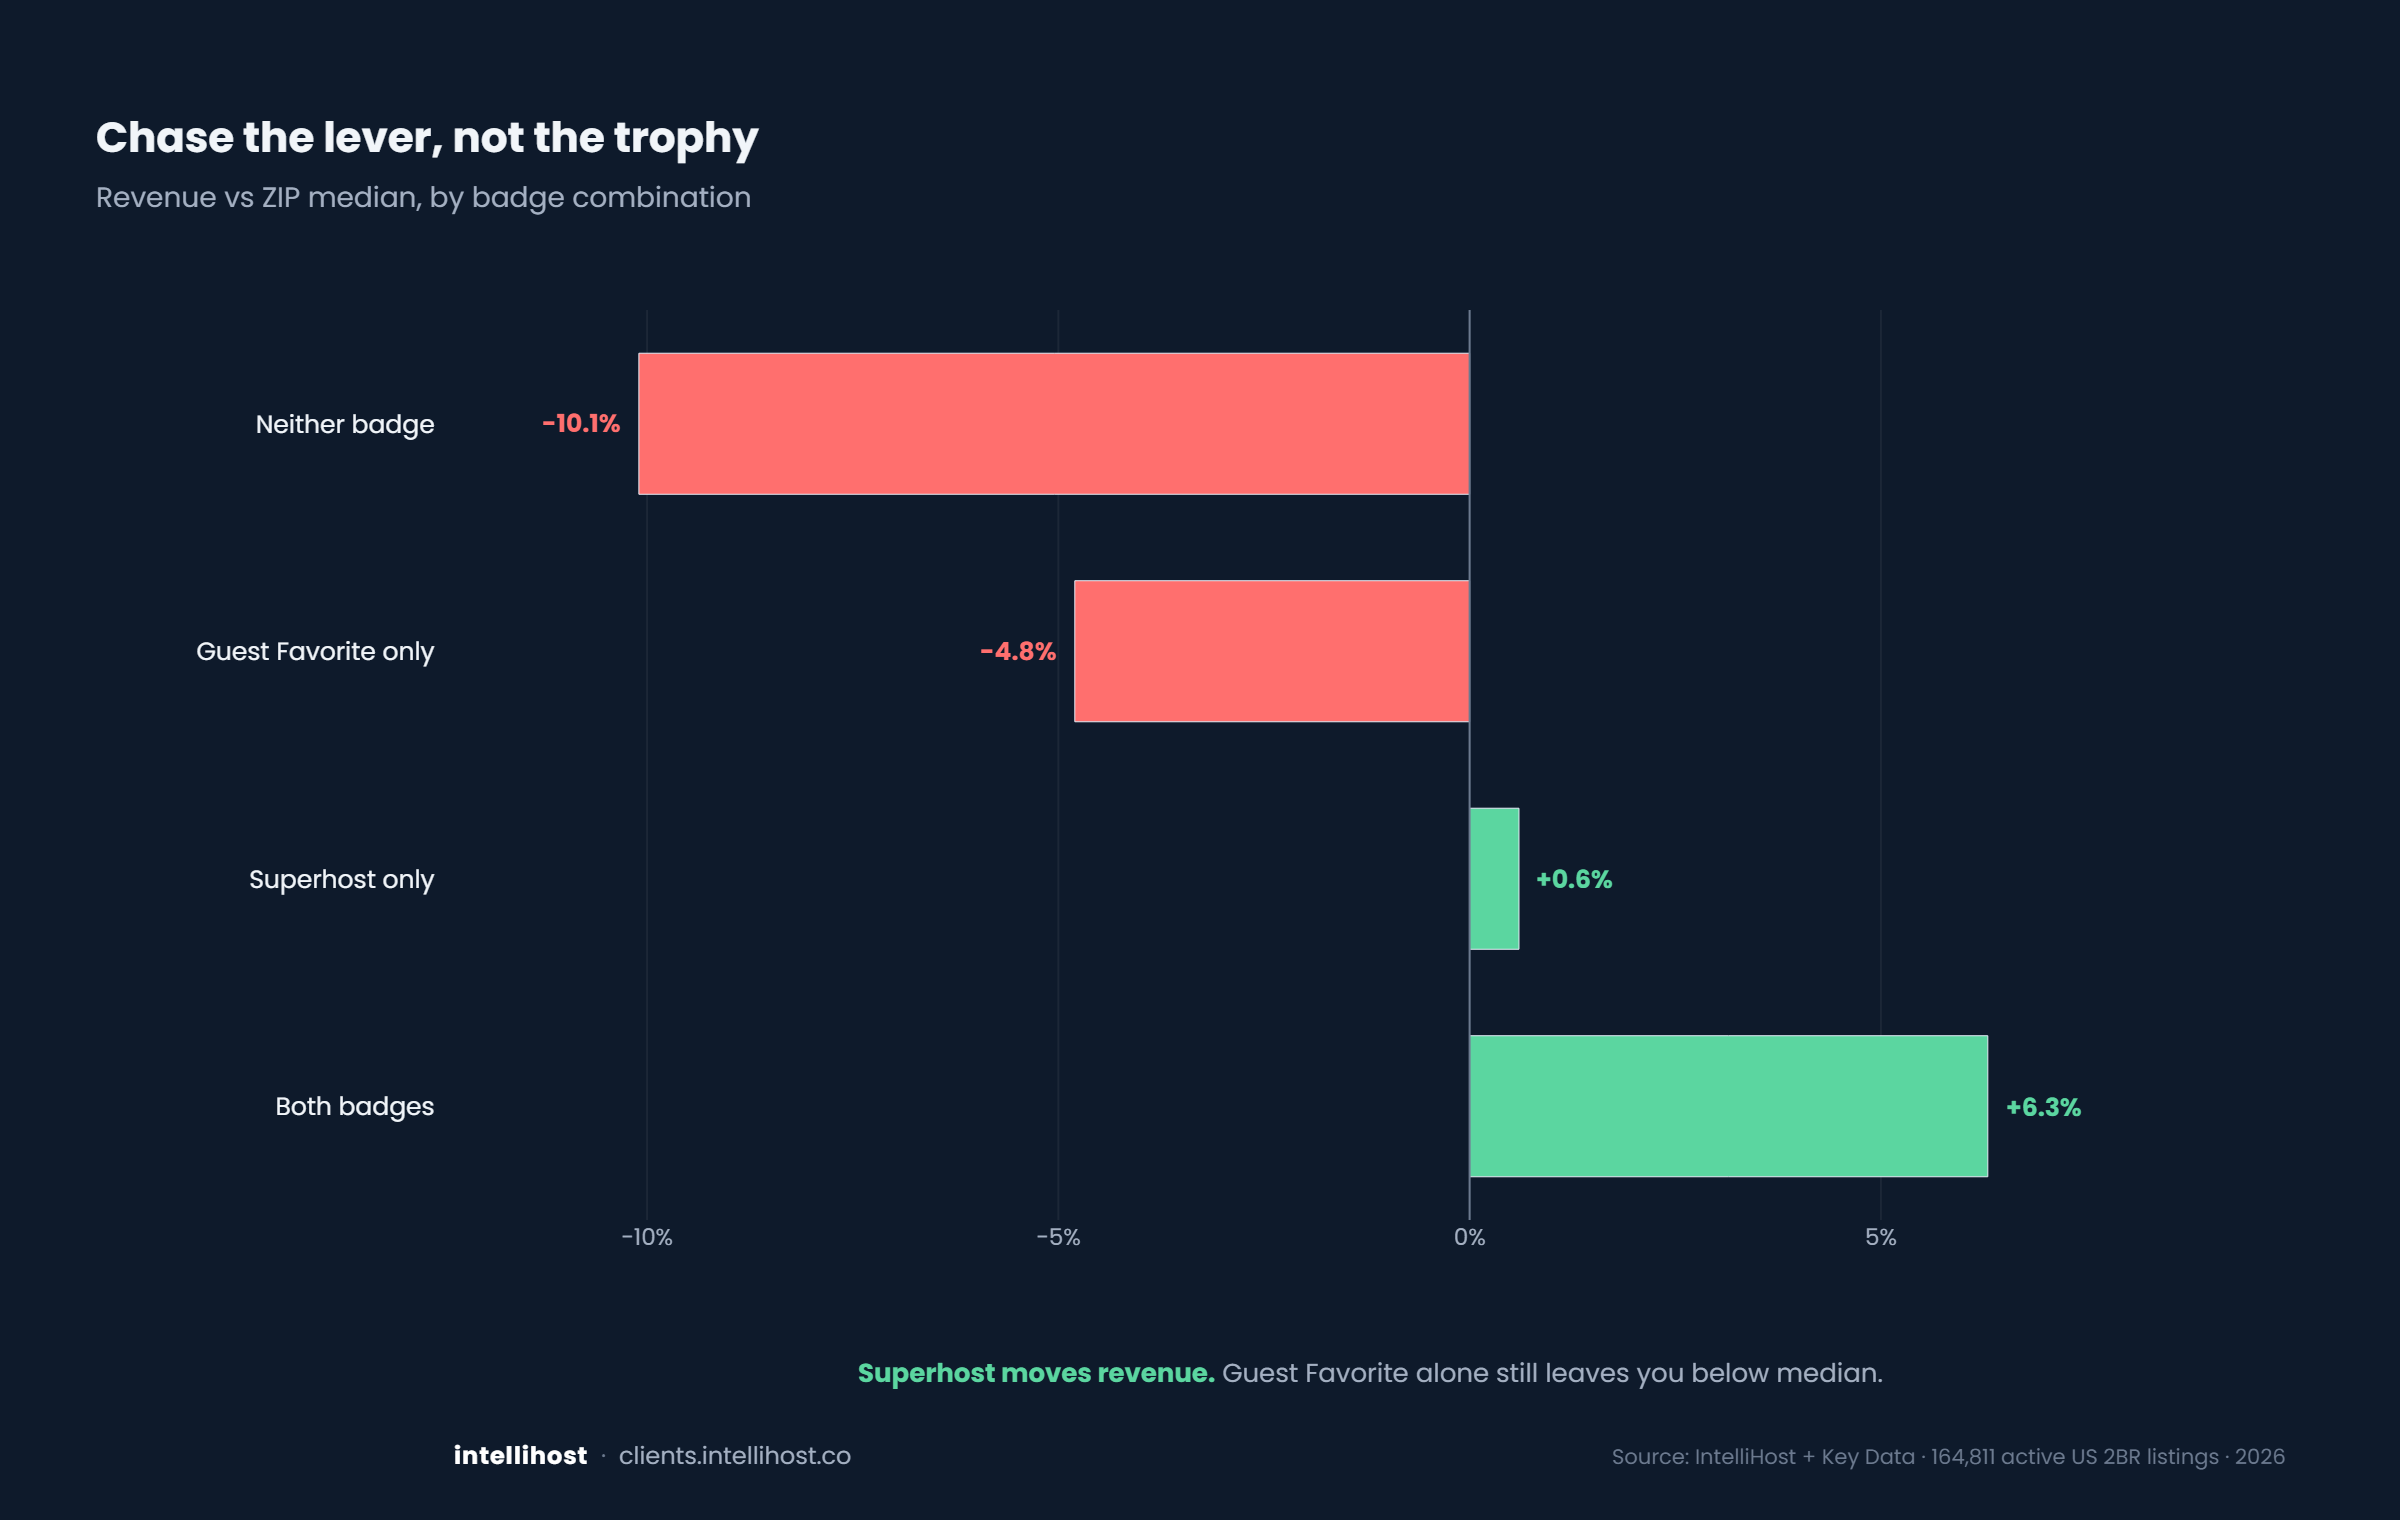
Chase the lever, not the trophy
Superhost moves money. Guest Favorite alone does not.
Operations
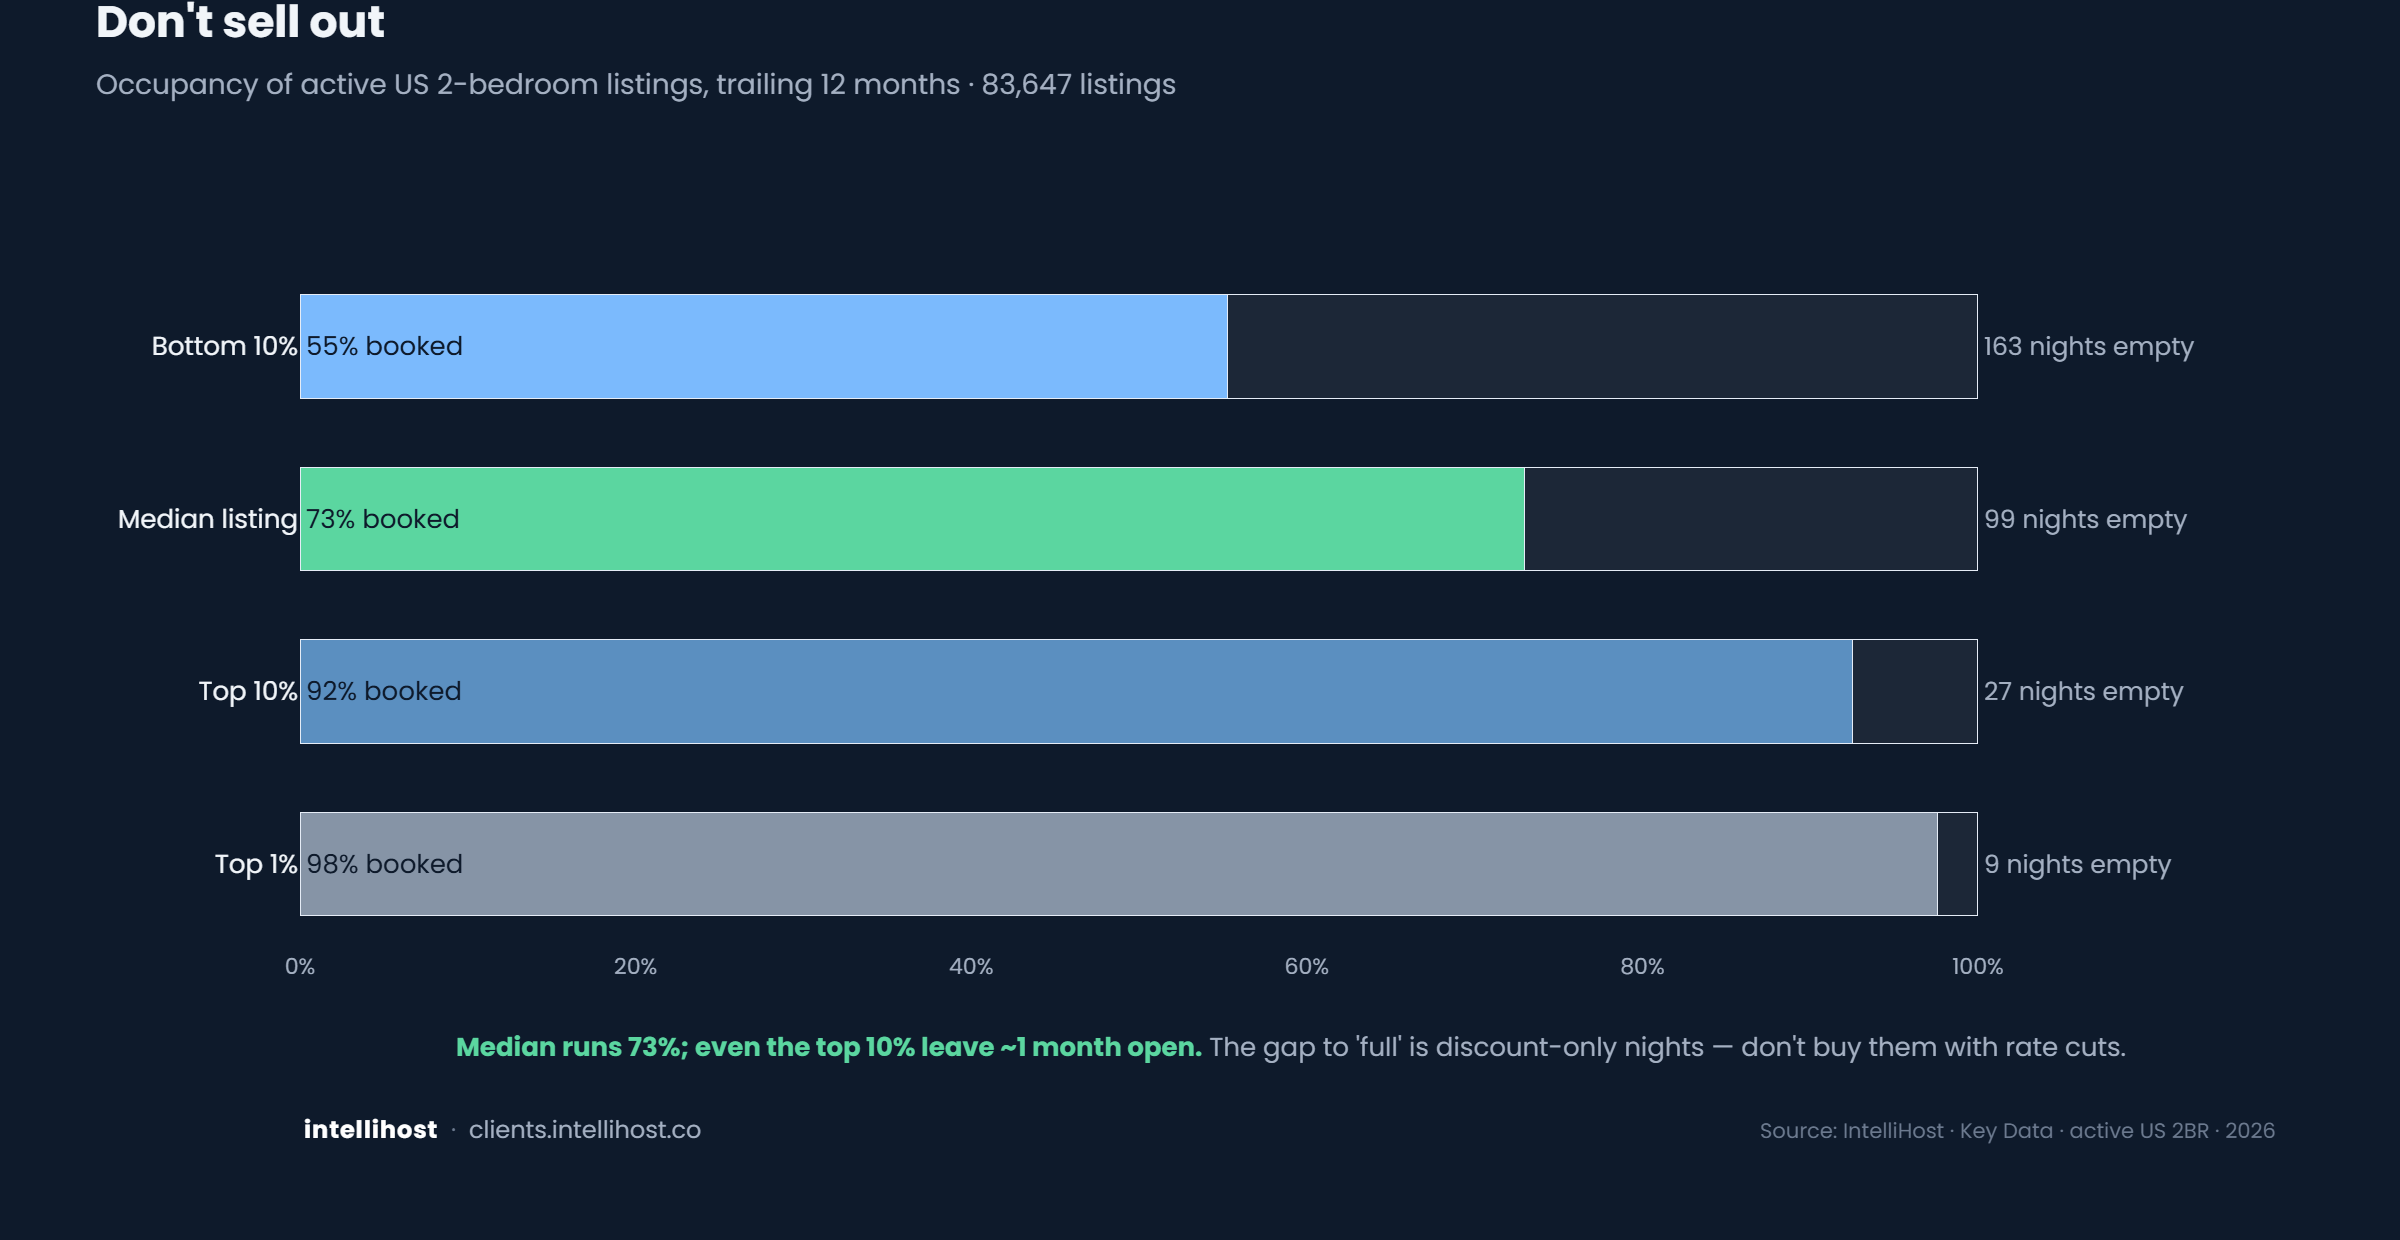
Don't sell out
Even the best leave a month empty.
Market
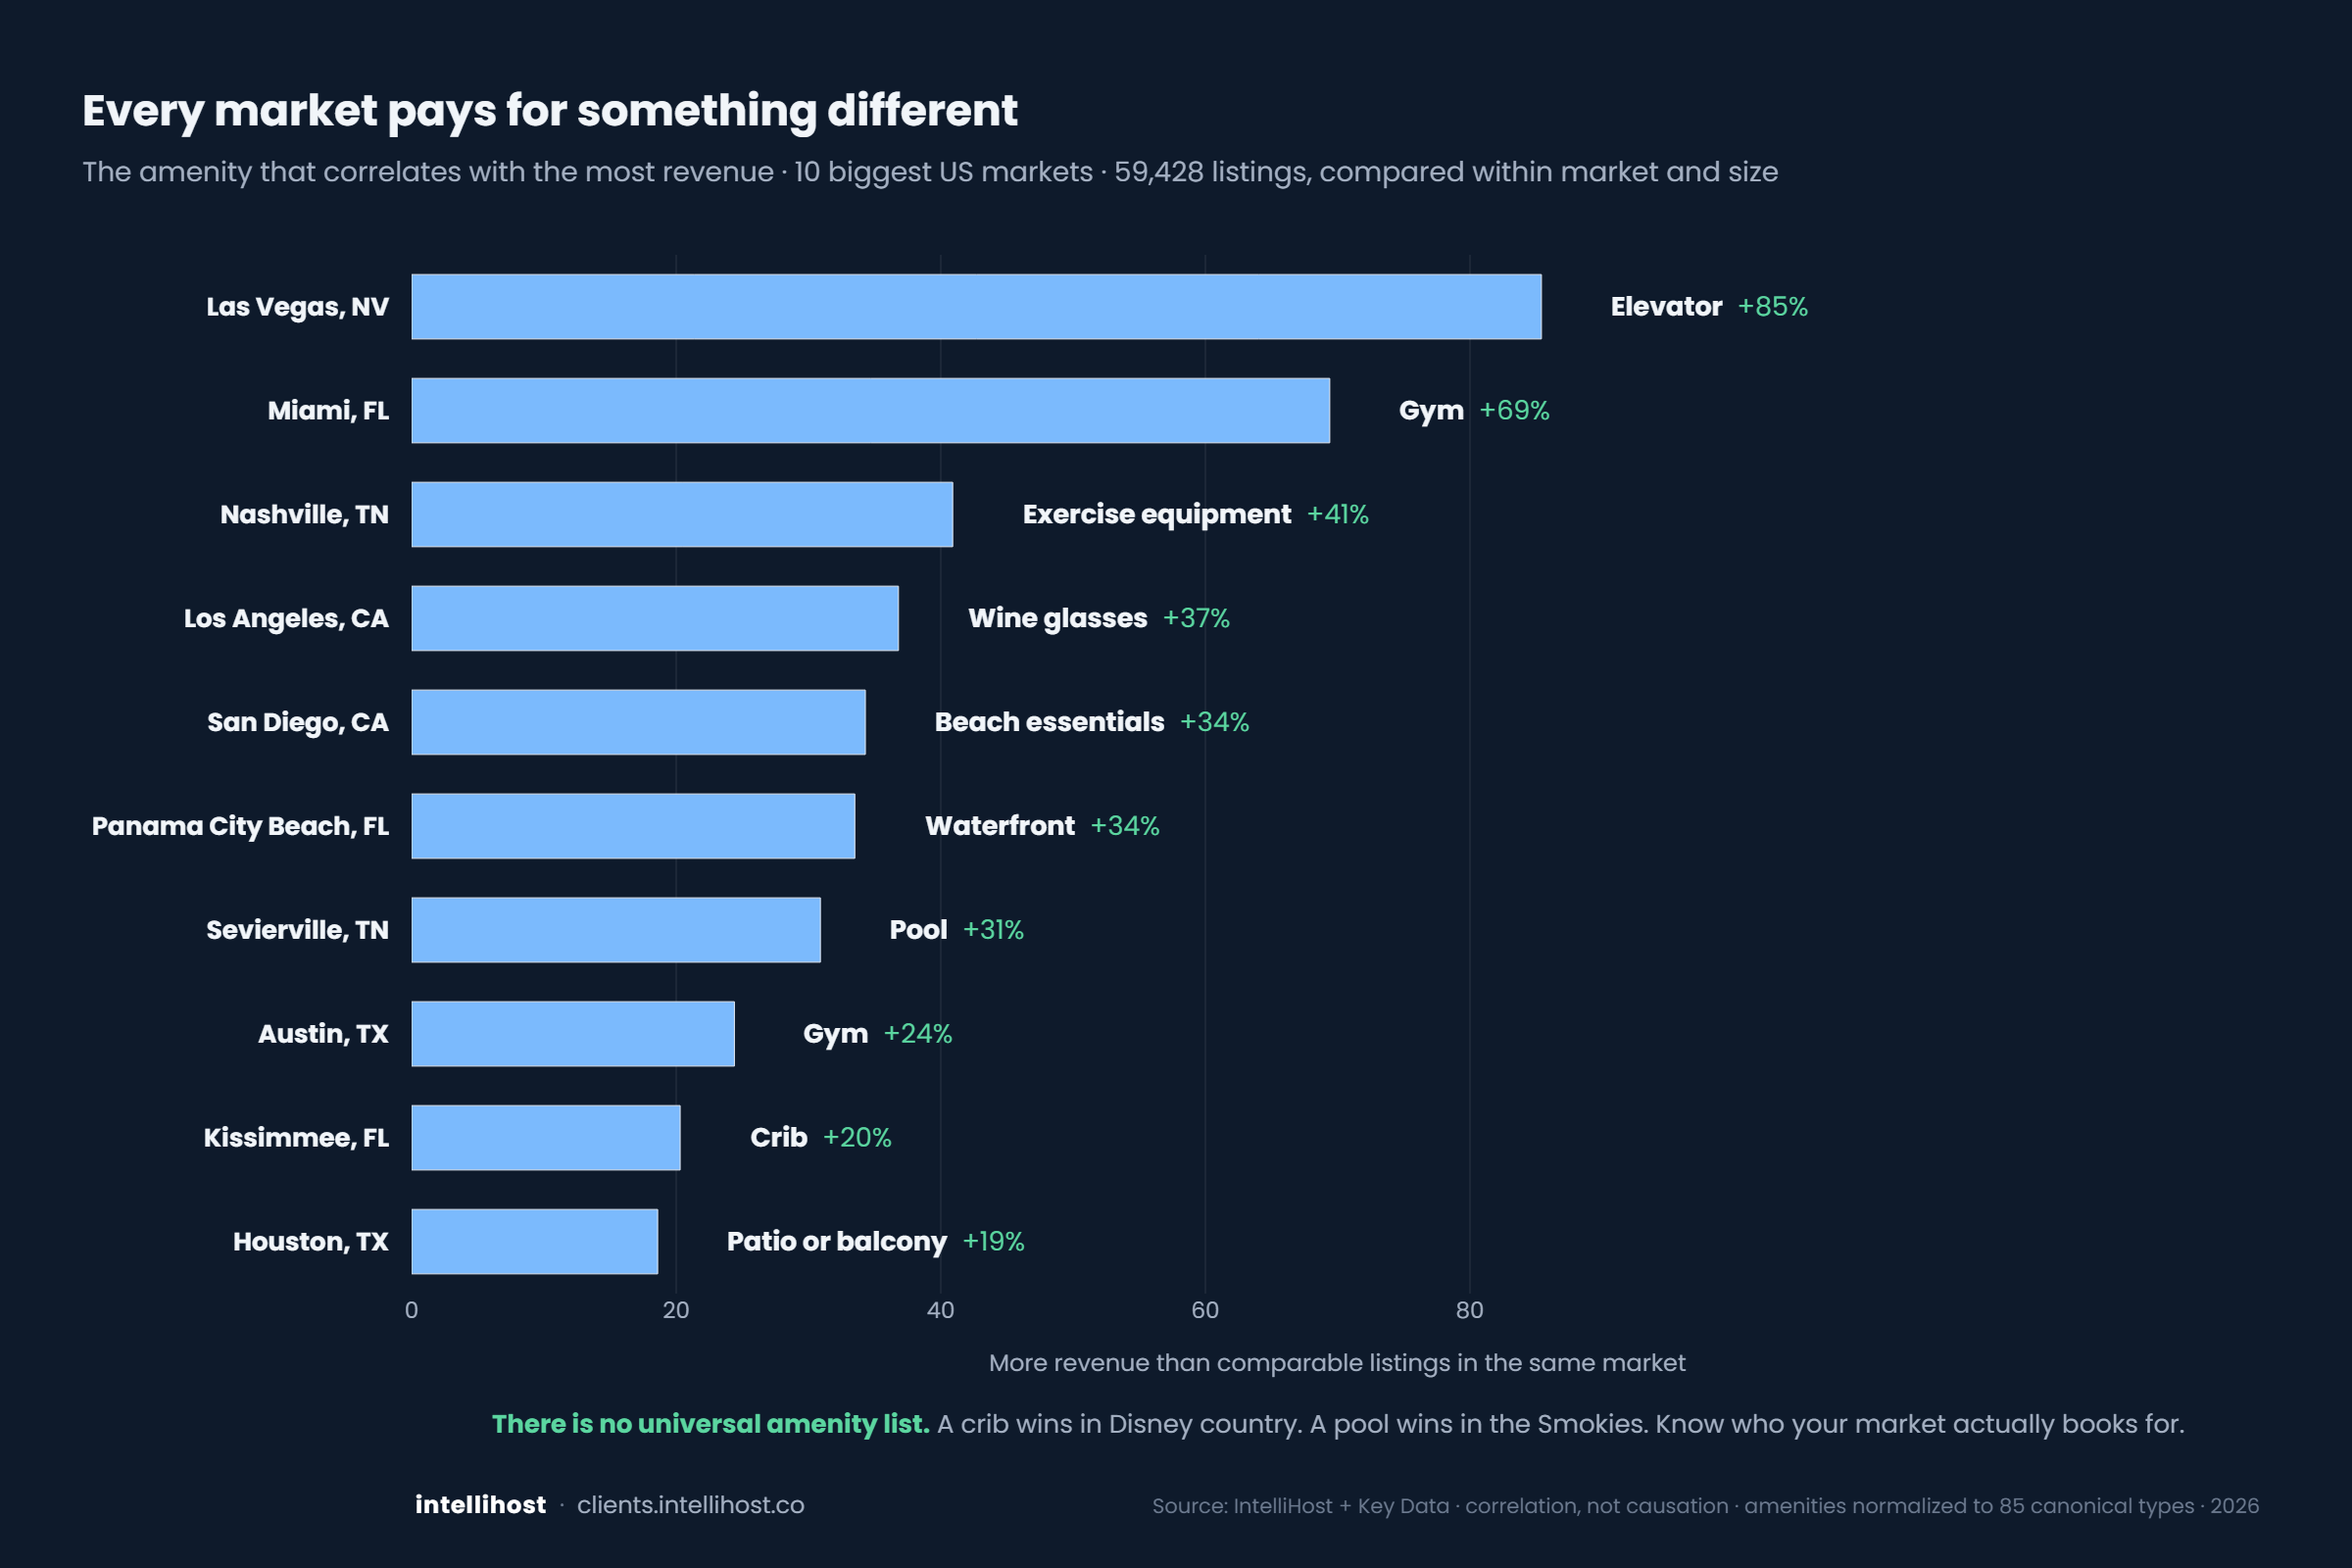
Every market pays for something different
There is no universal amenity list.
Reviews
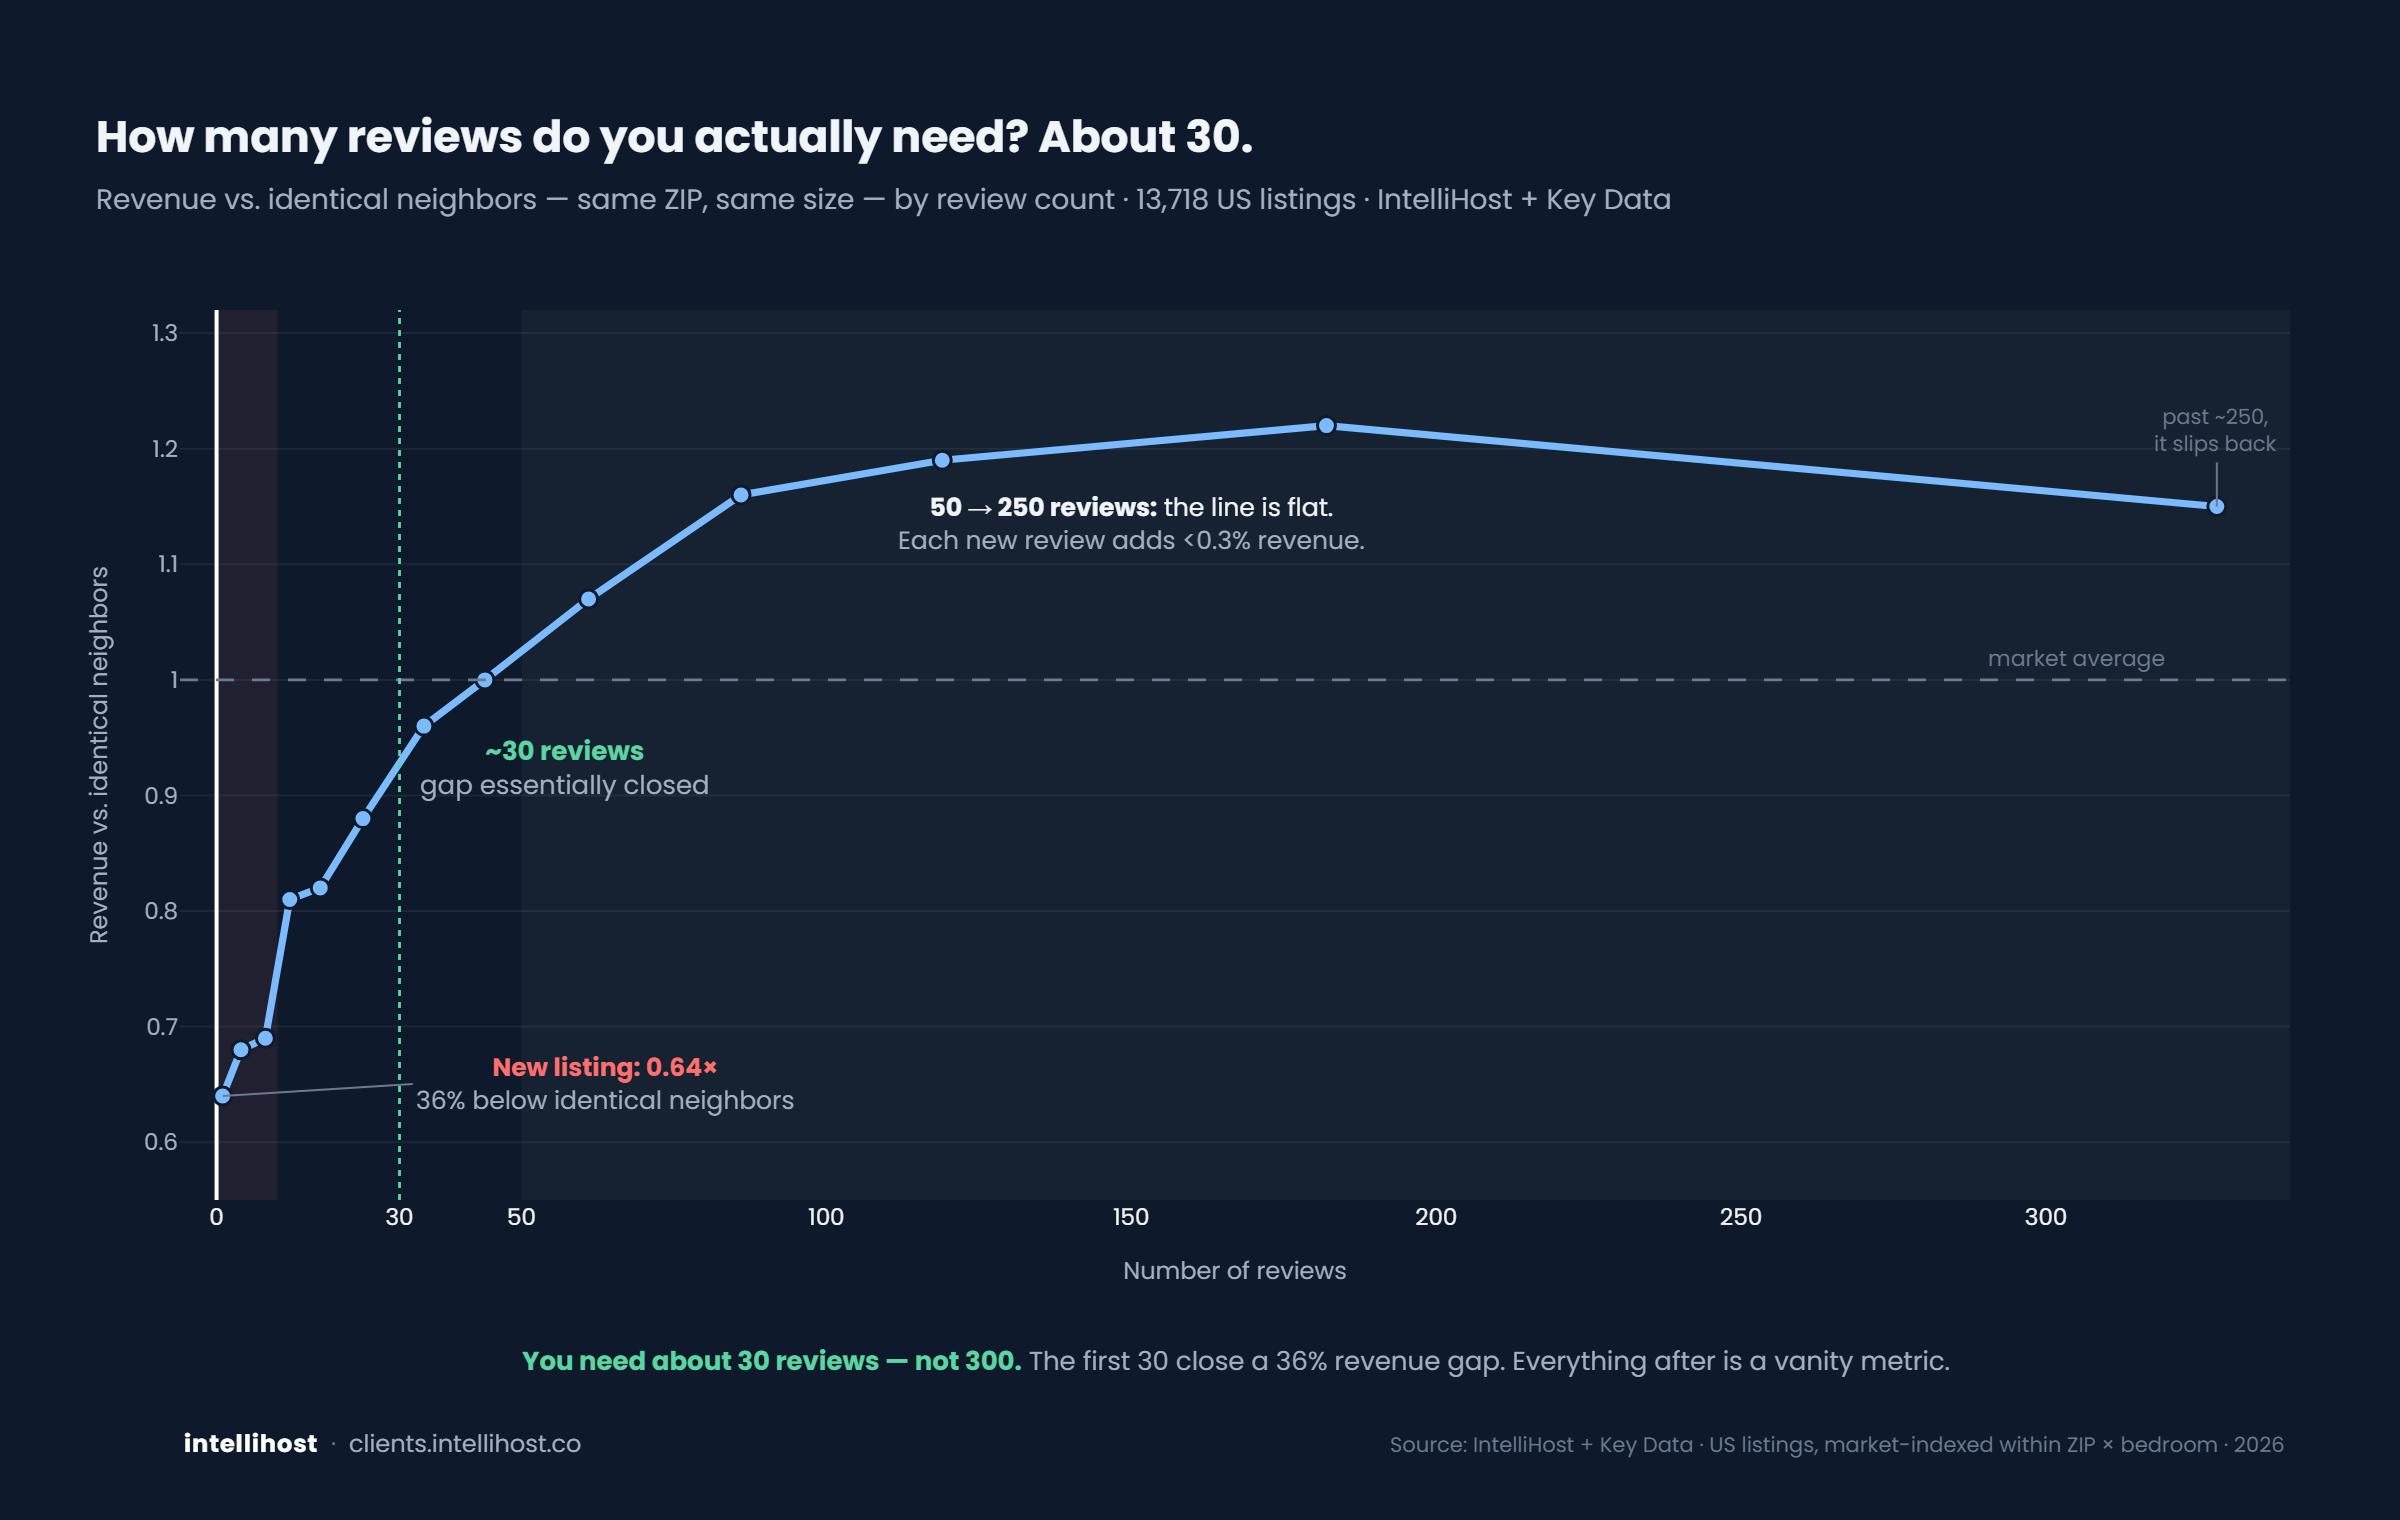
How many reviews do you actually need?
About 30. Not 300.
Property
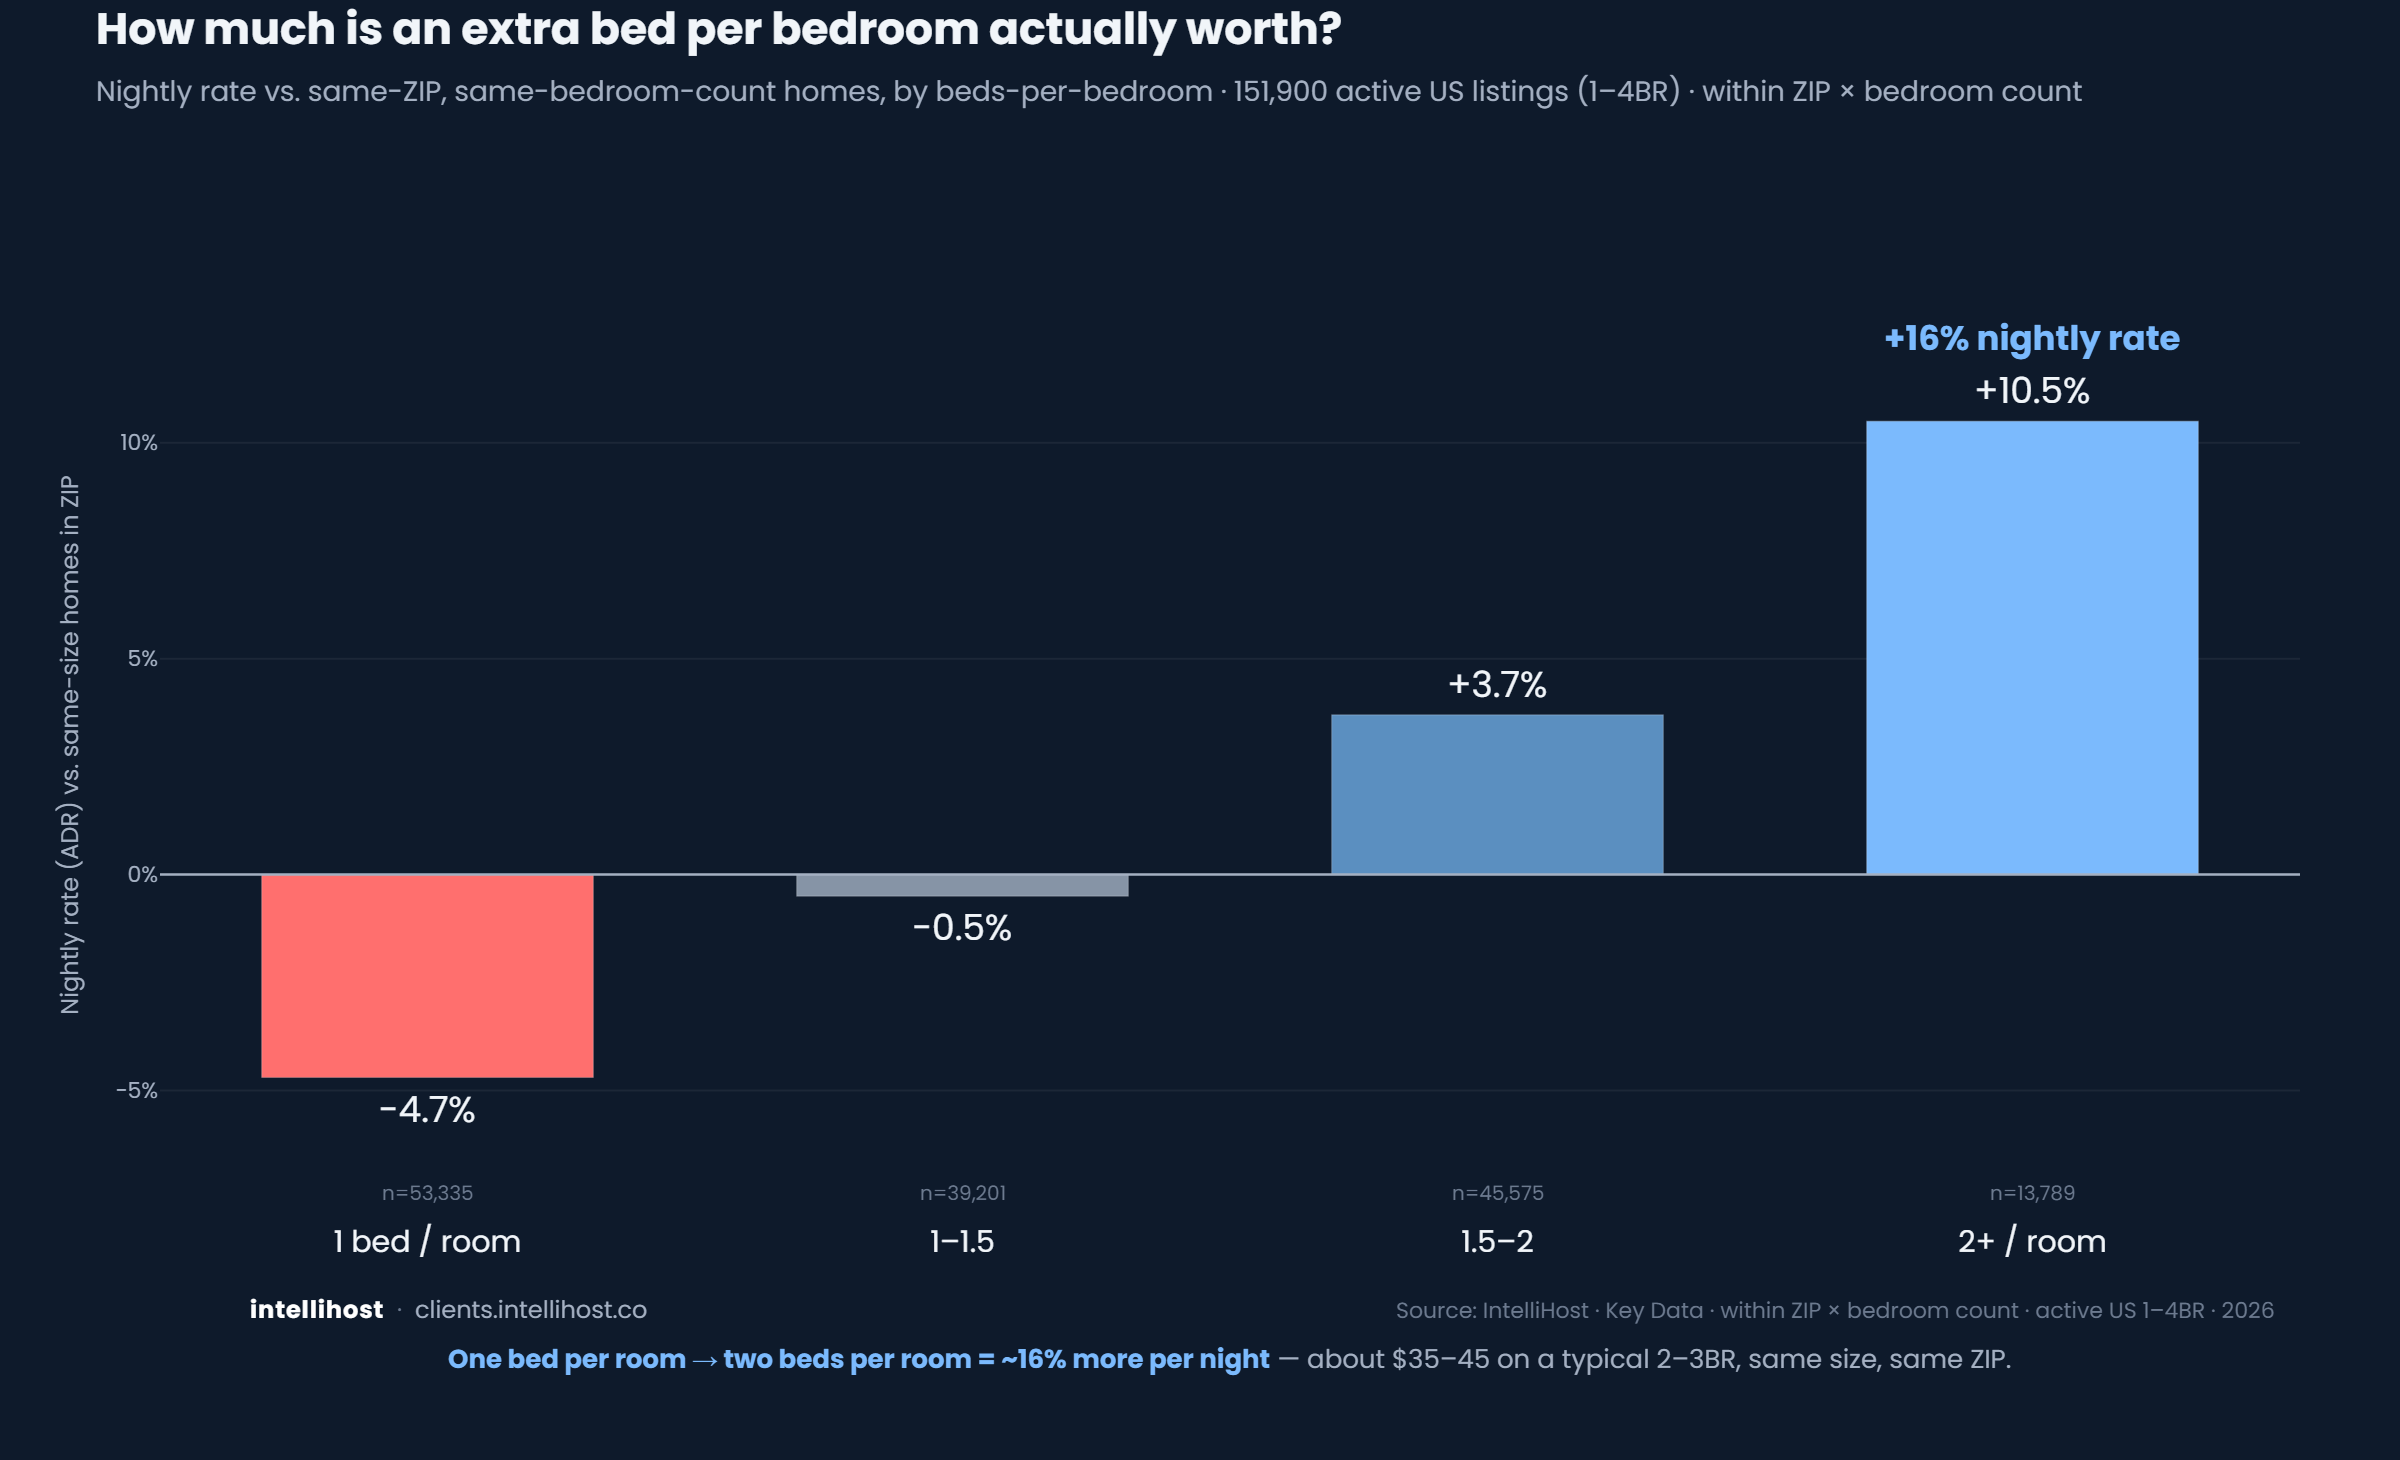
How much is an extra bed per bedroom worth?
About 16% on the nightly rate.
Property
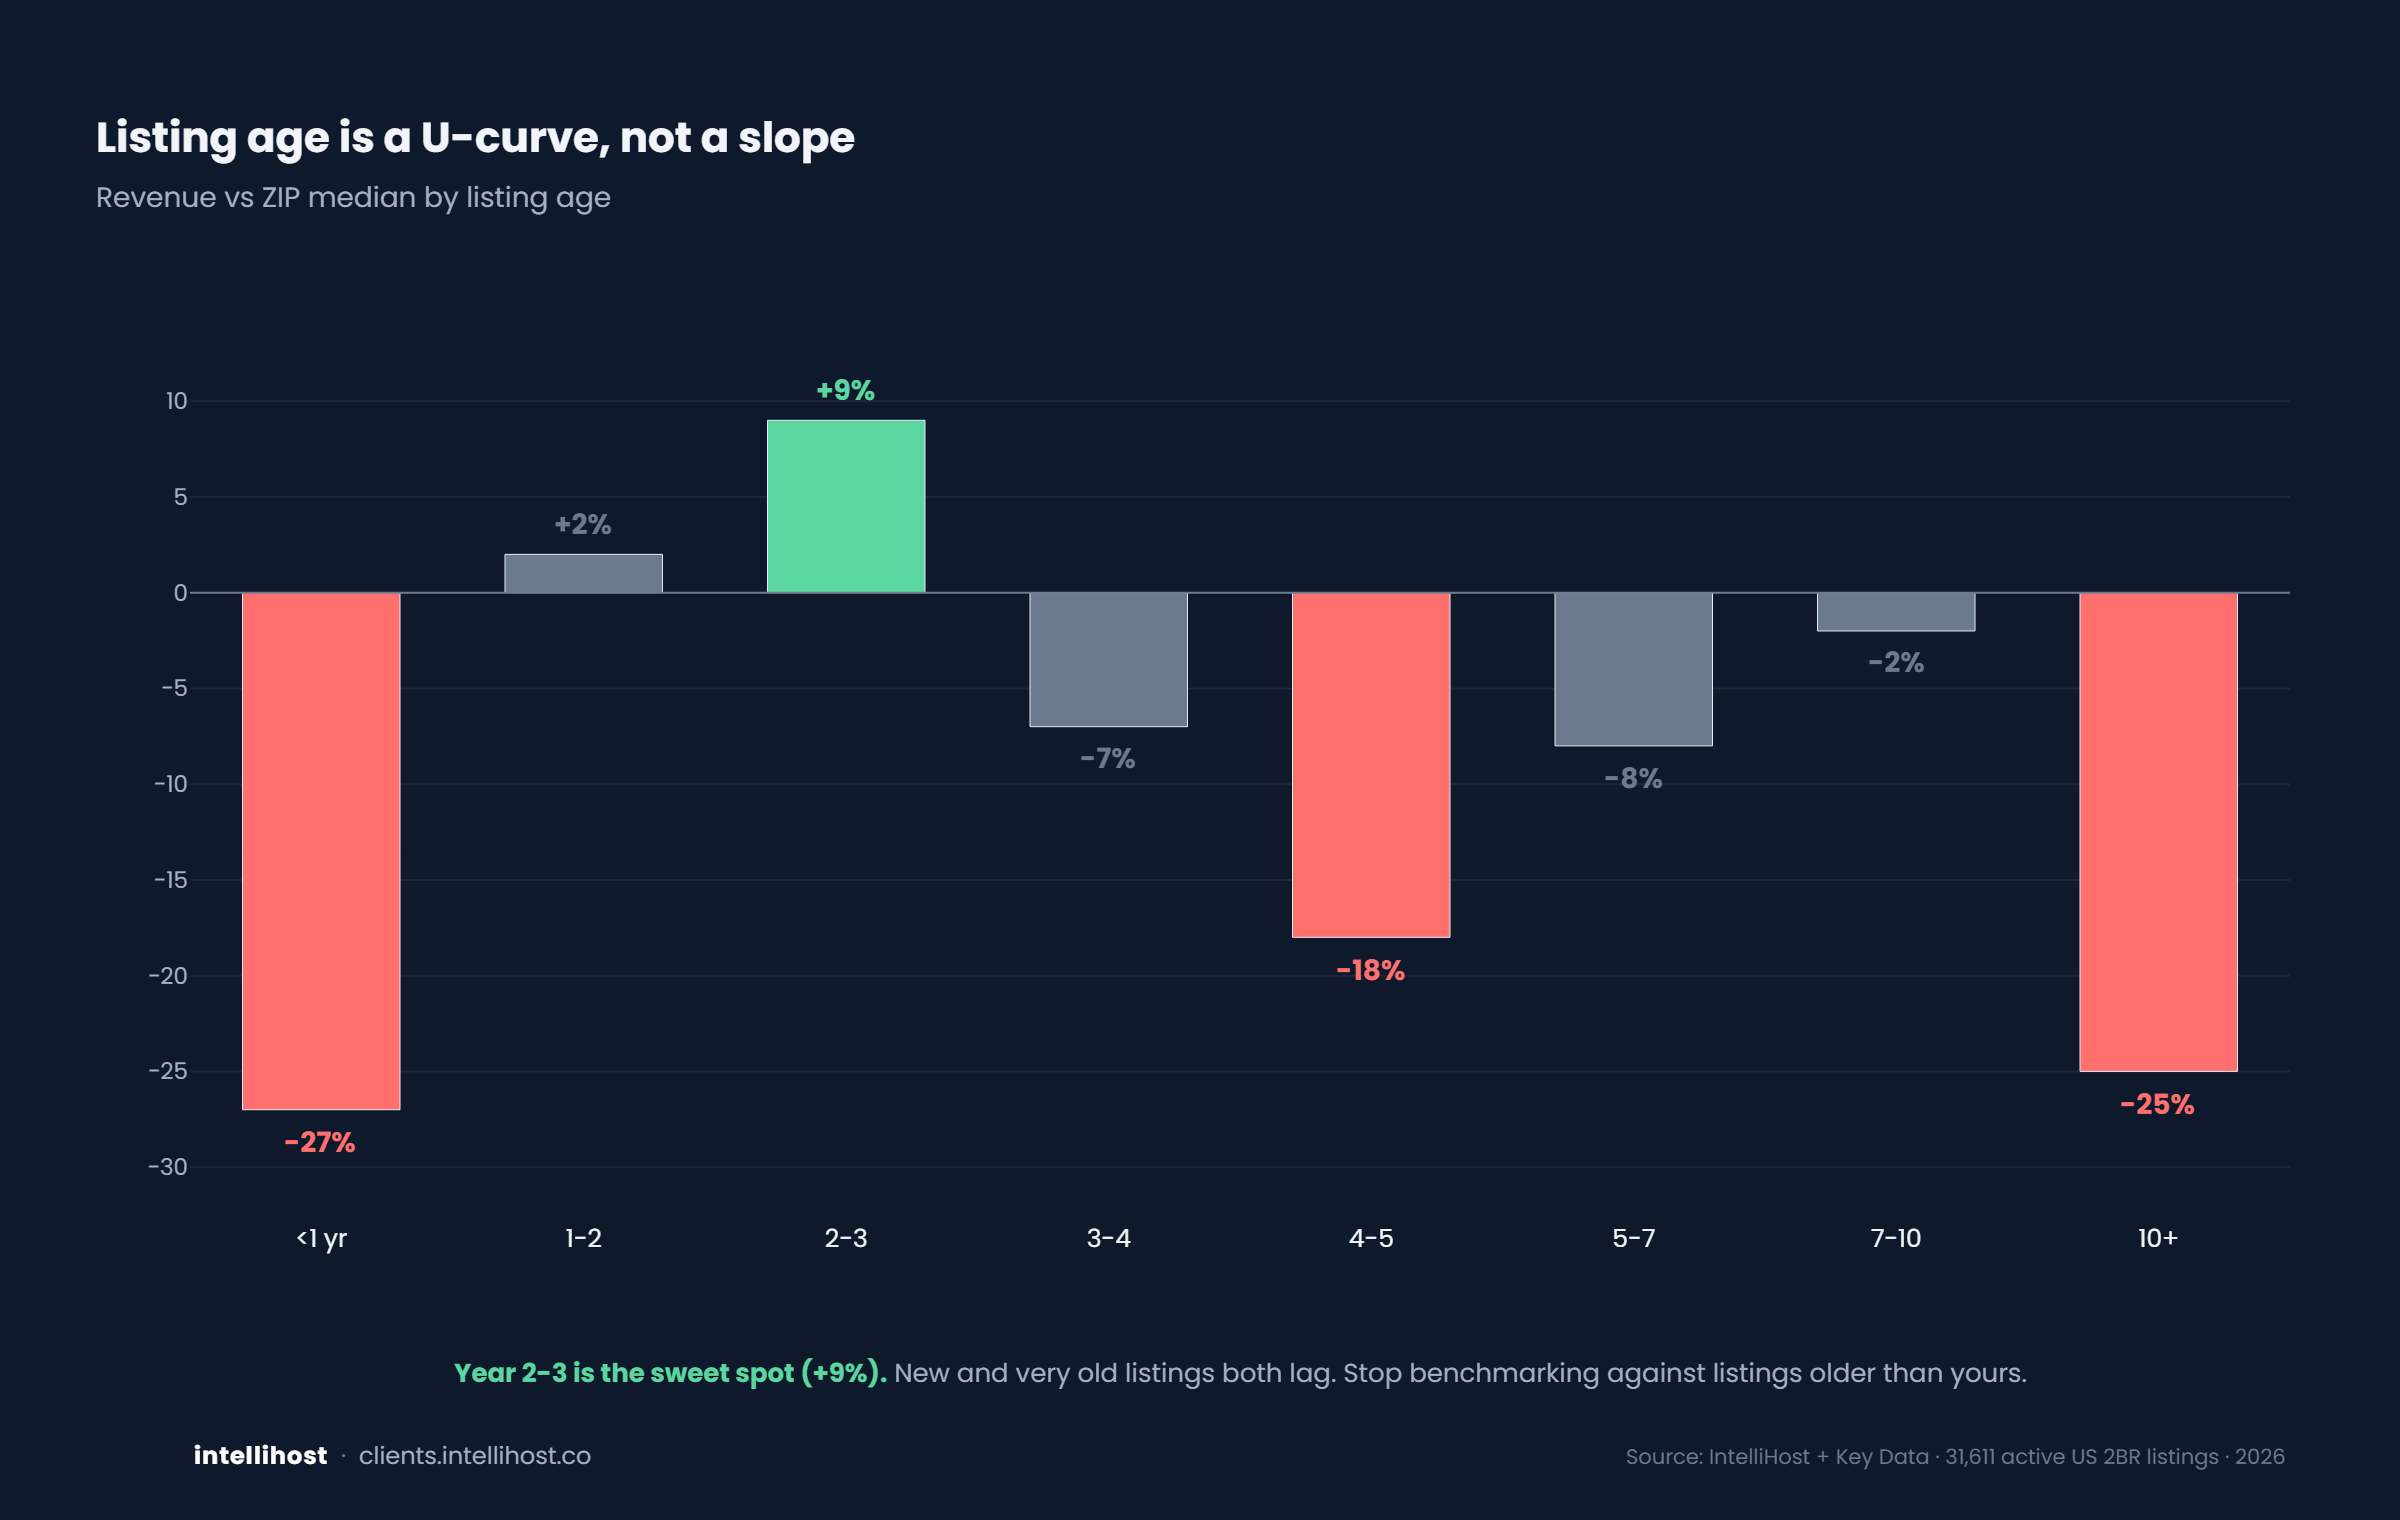
Listing age is a U-curve, not a slope
Year 2-3 is the sweet spot.
Listing craft
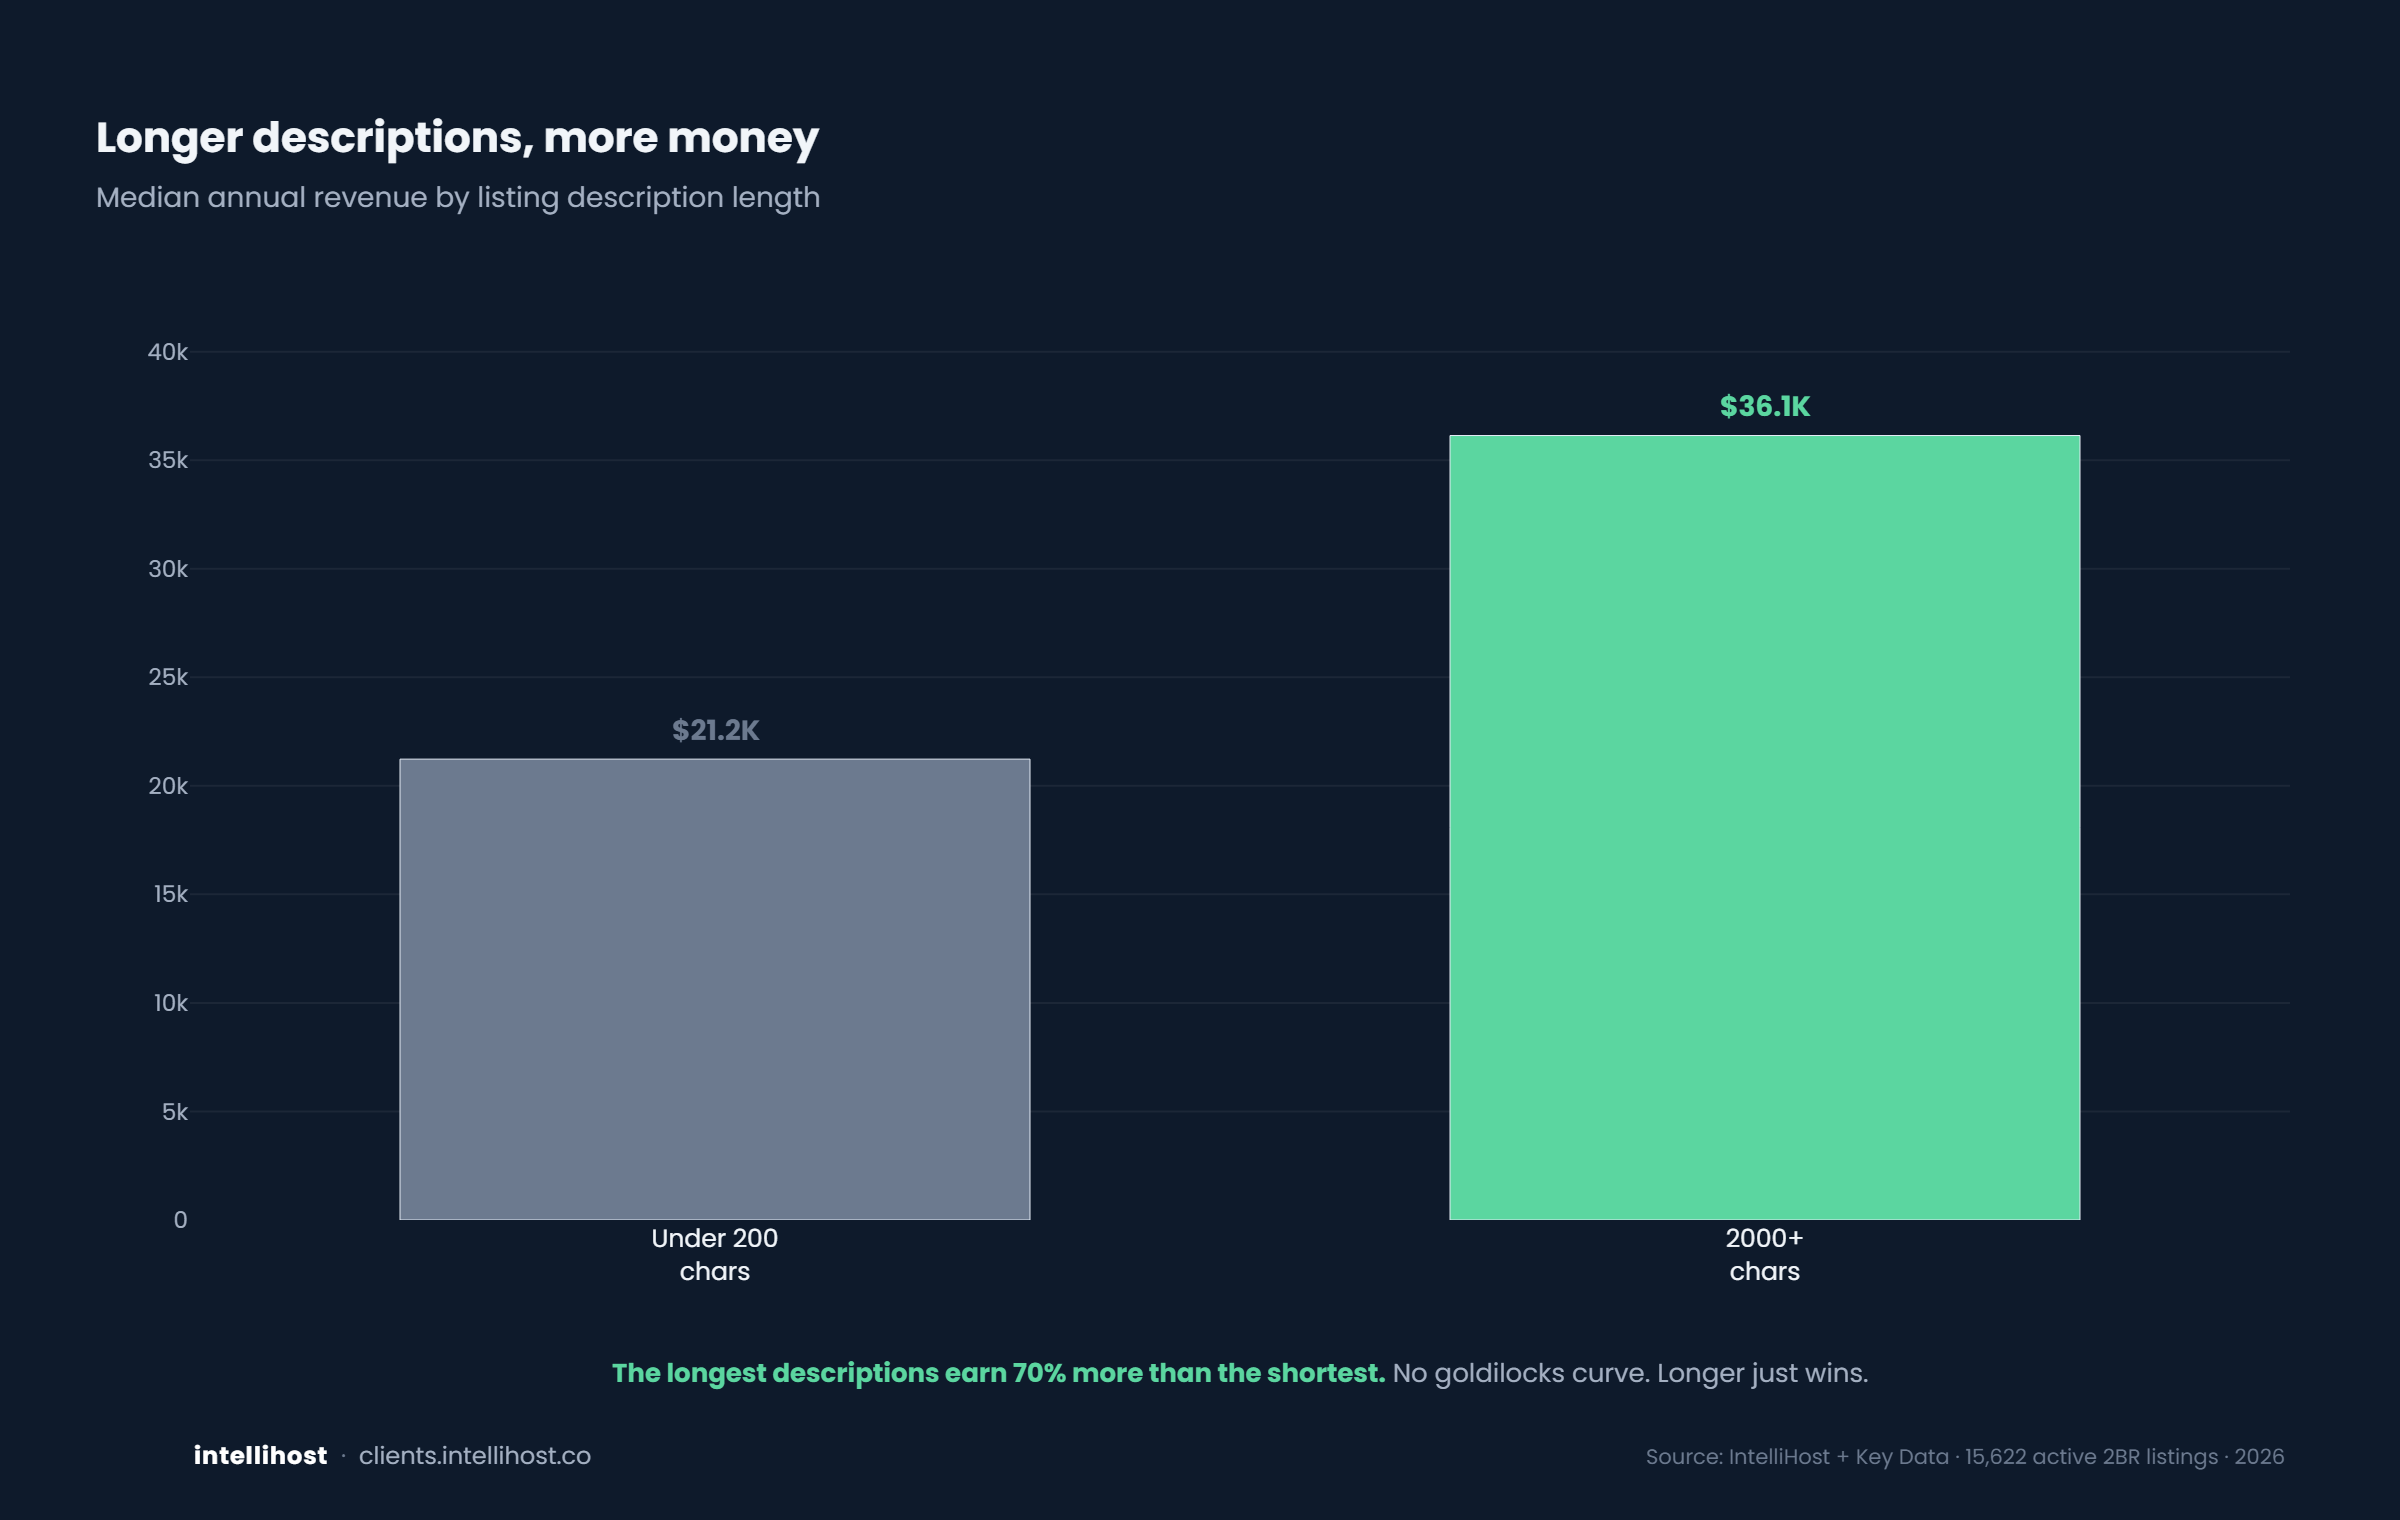
Longer descriptions, more money
There is no goldilocks curve.
Pricing
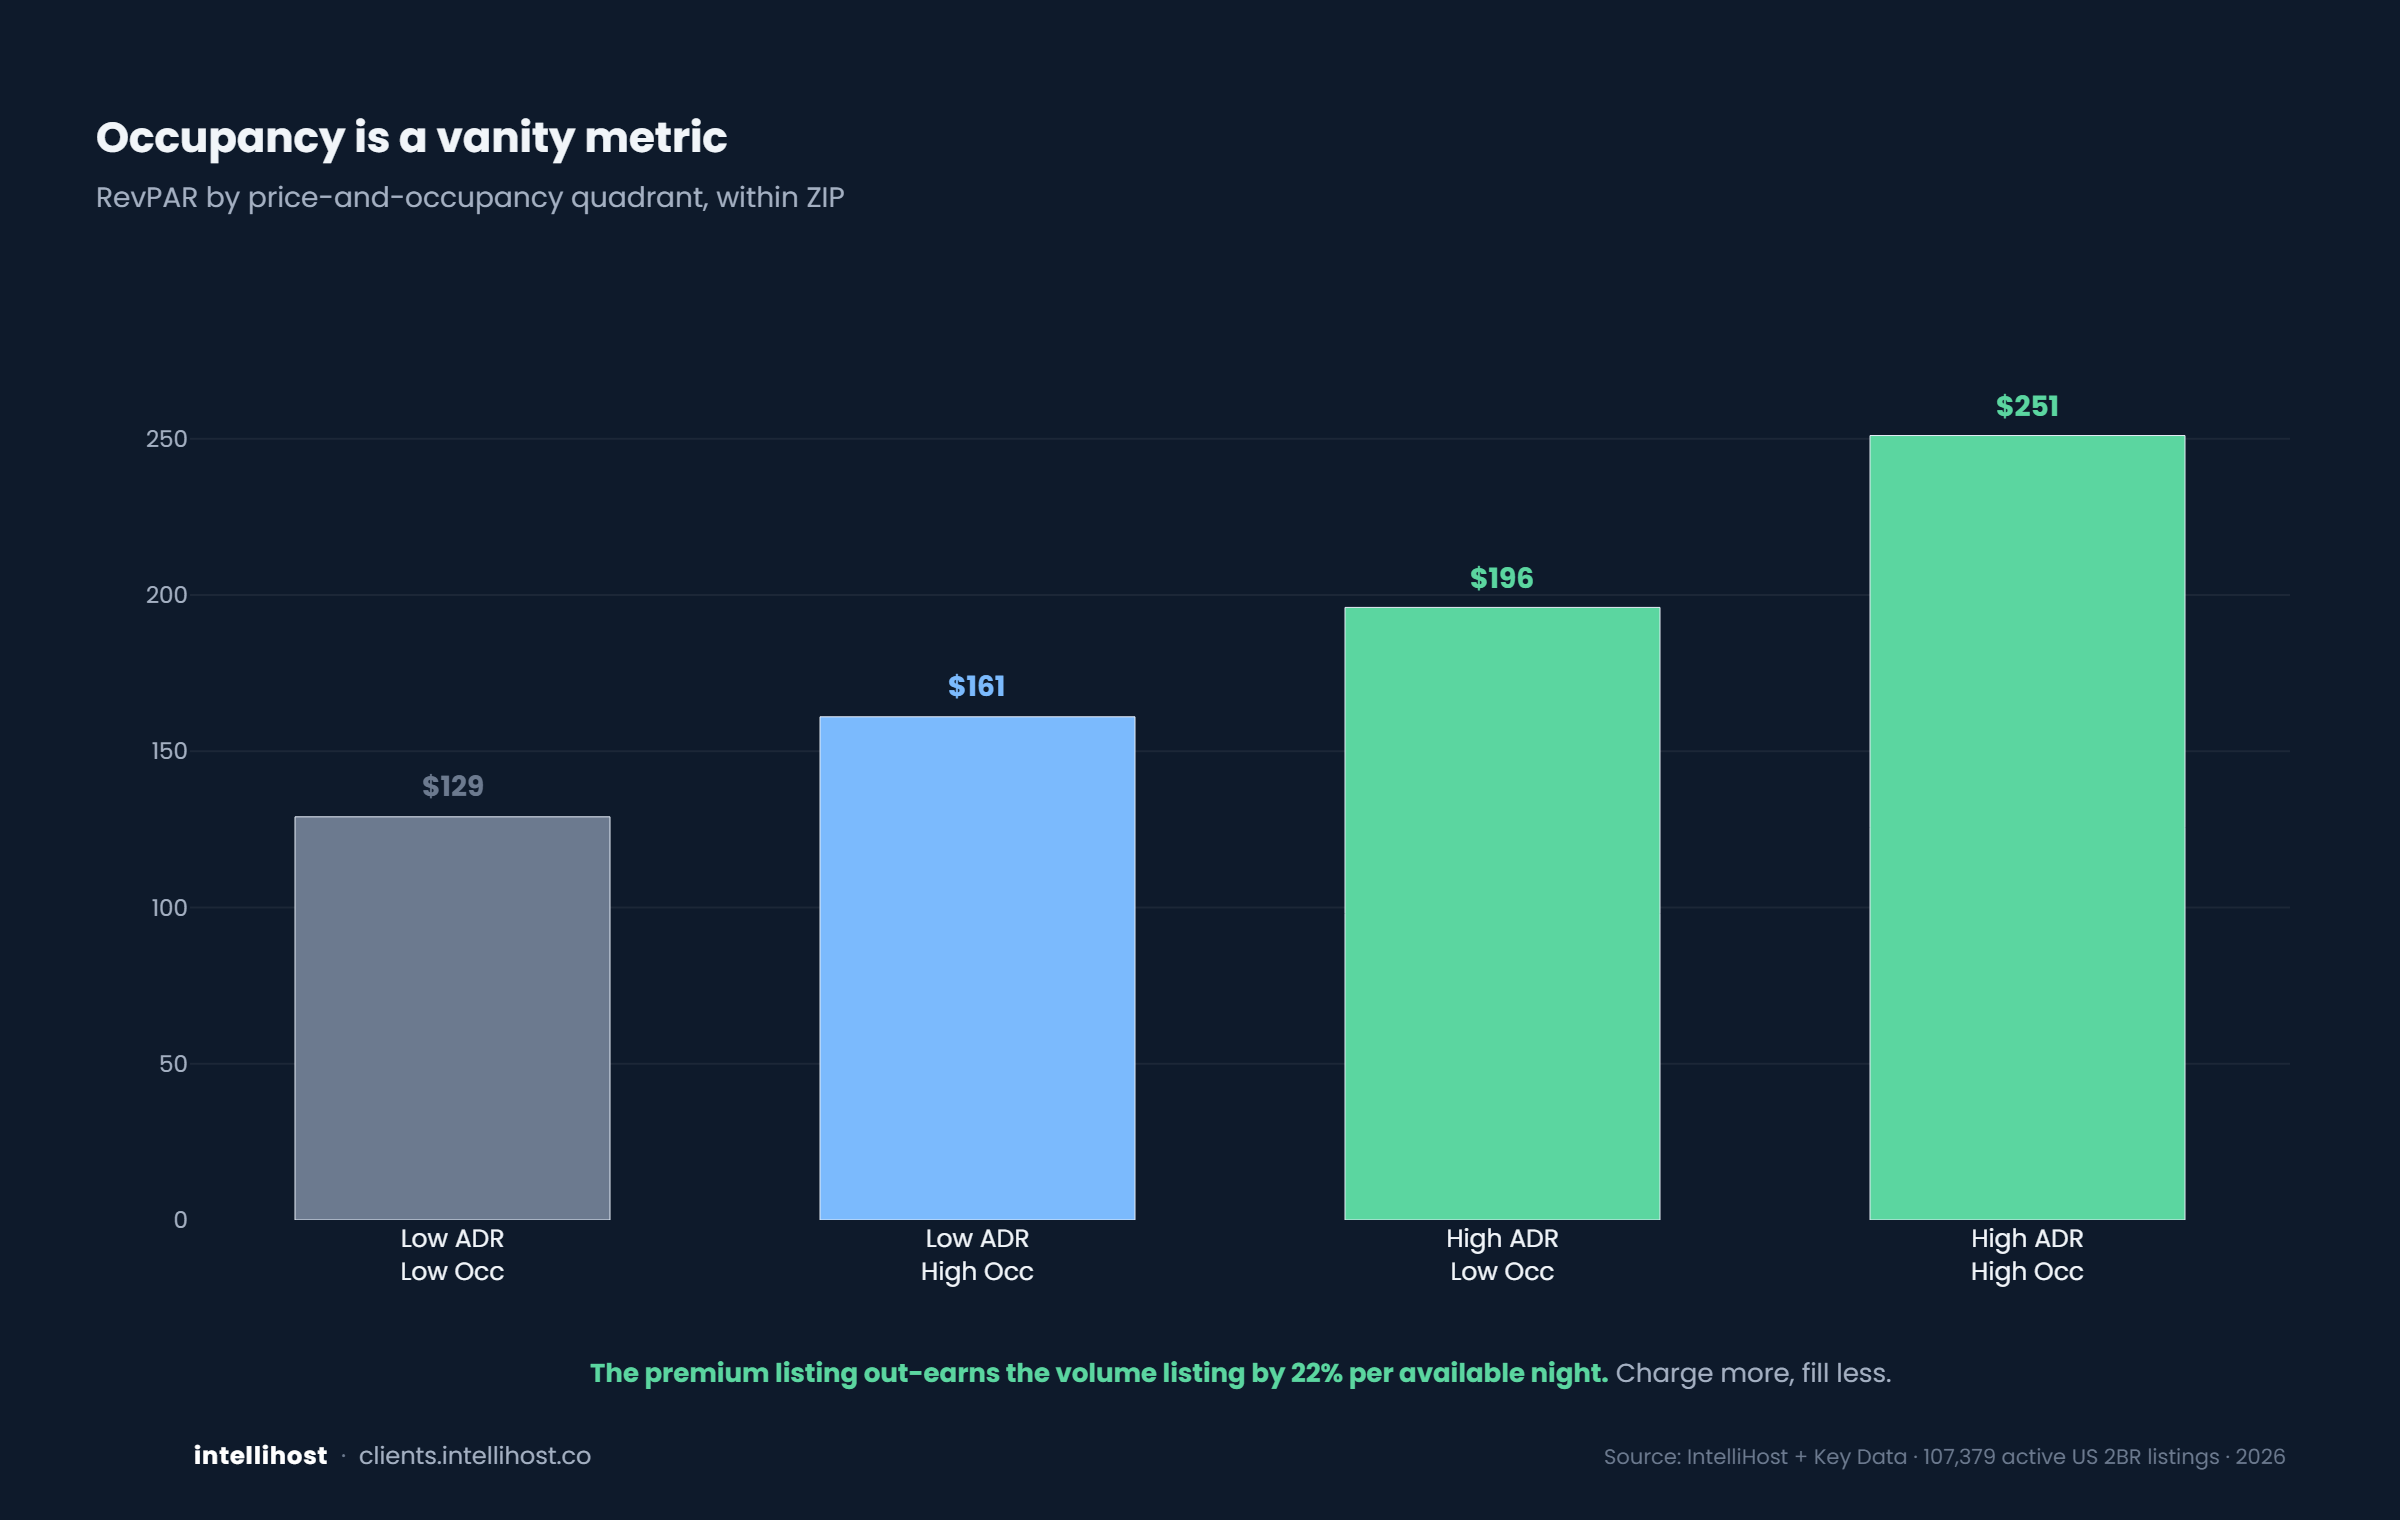
Occupancy is a vanity metric
Charge more, fill less, earn more.
Property
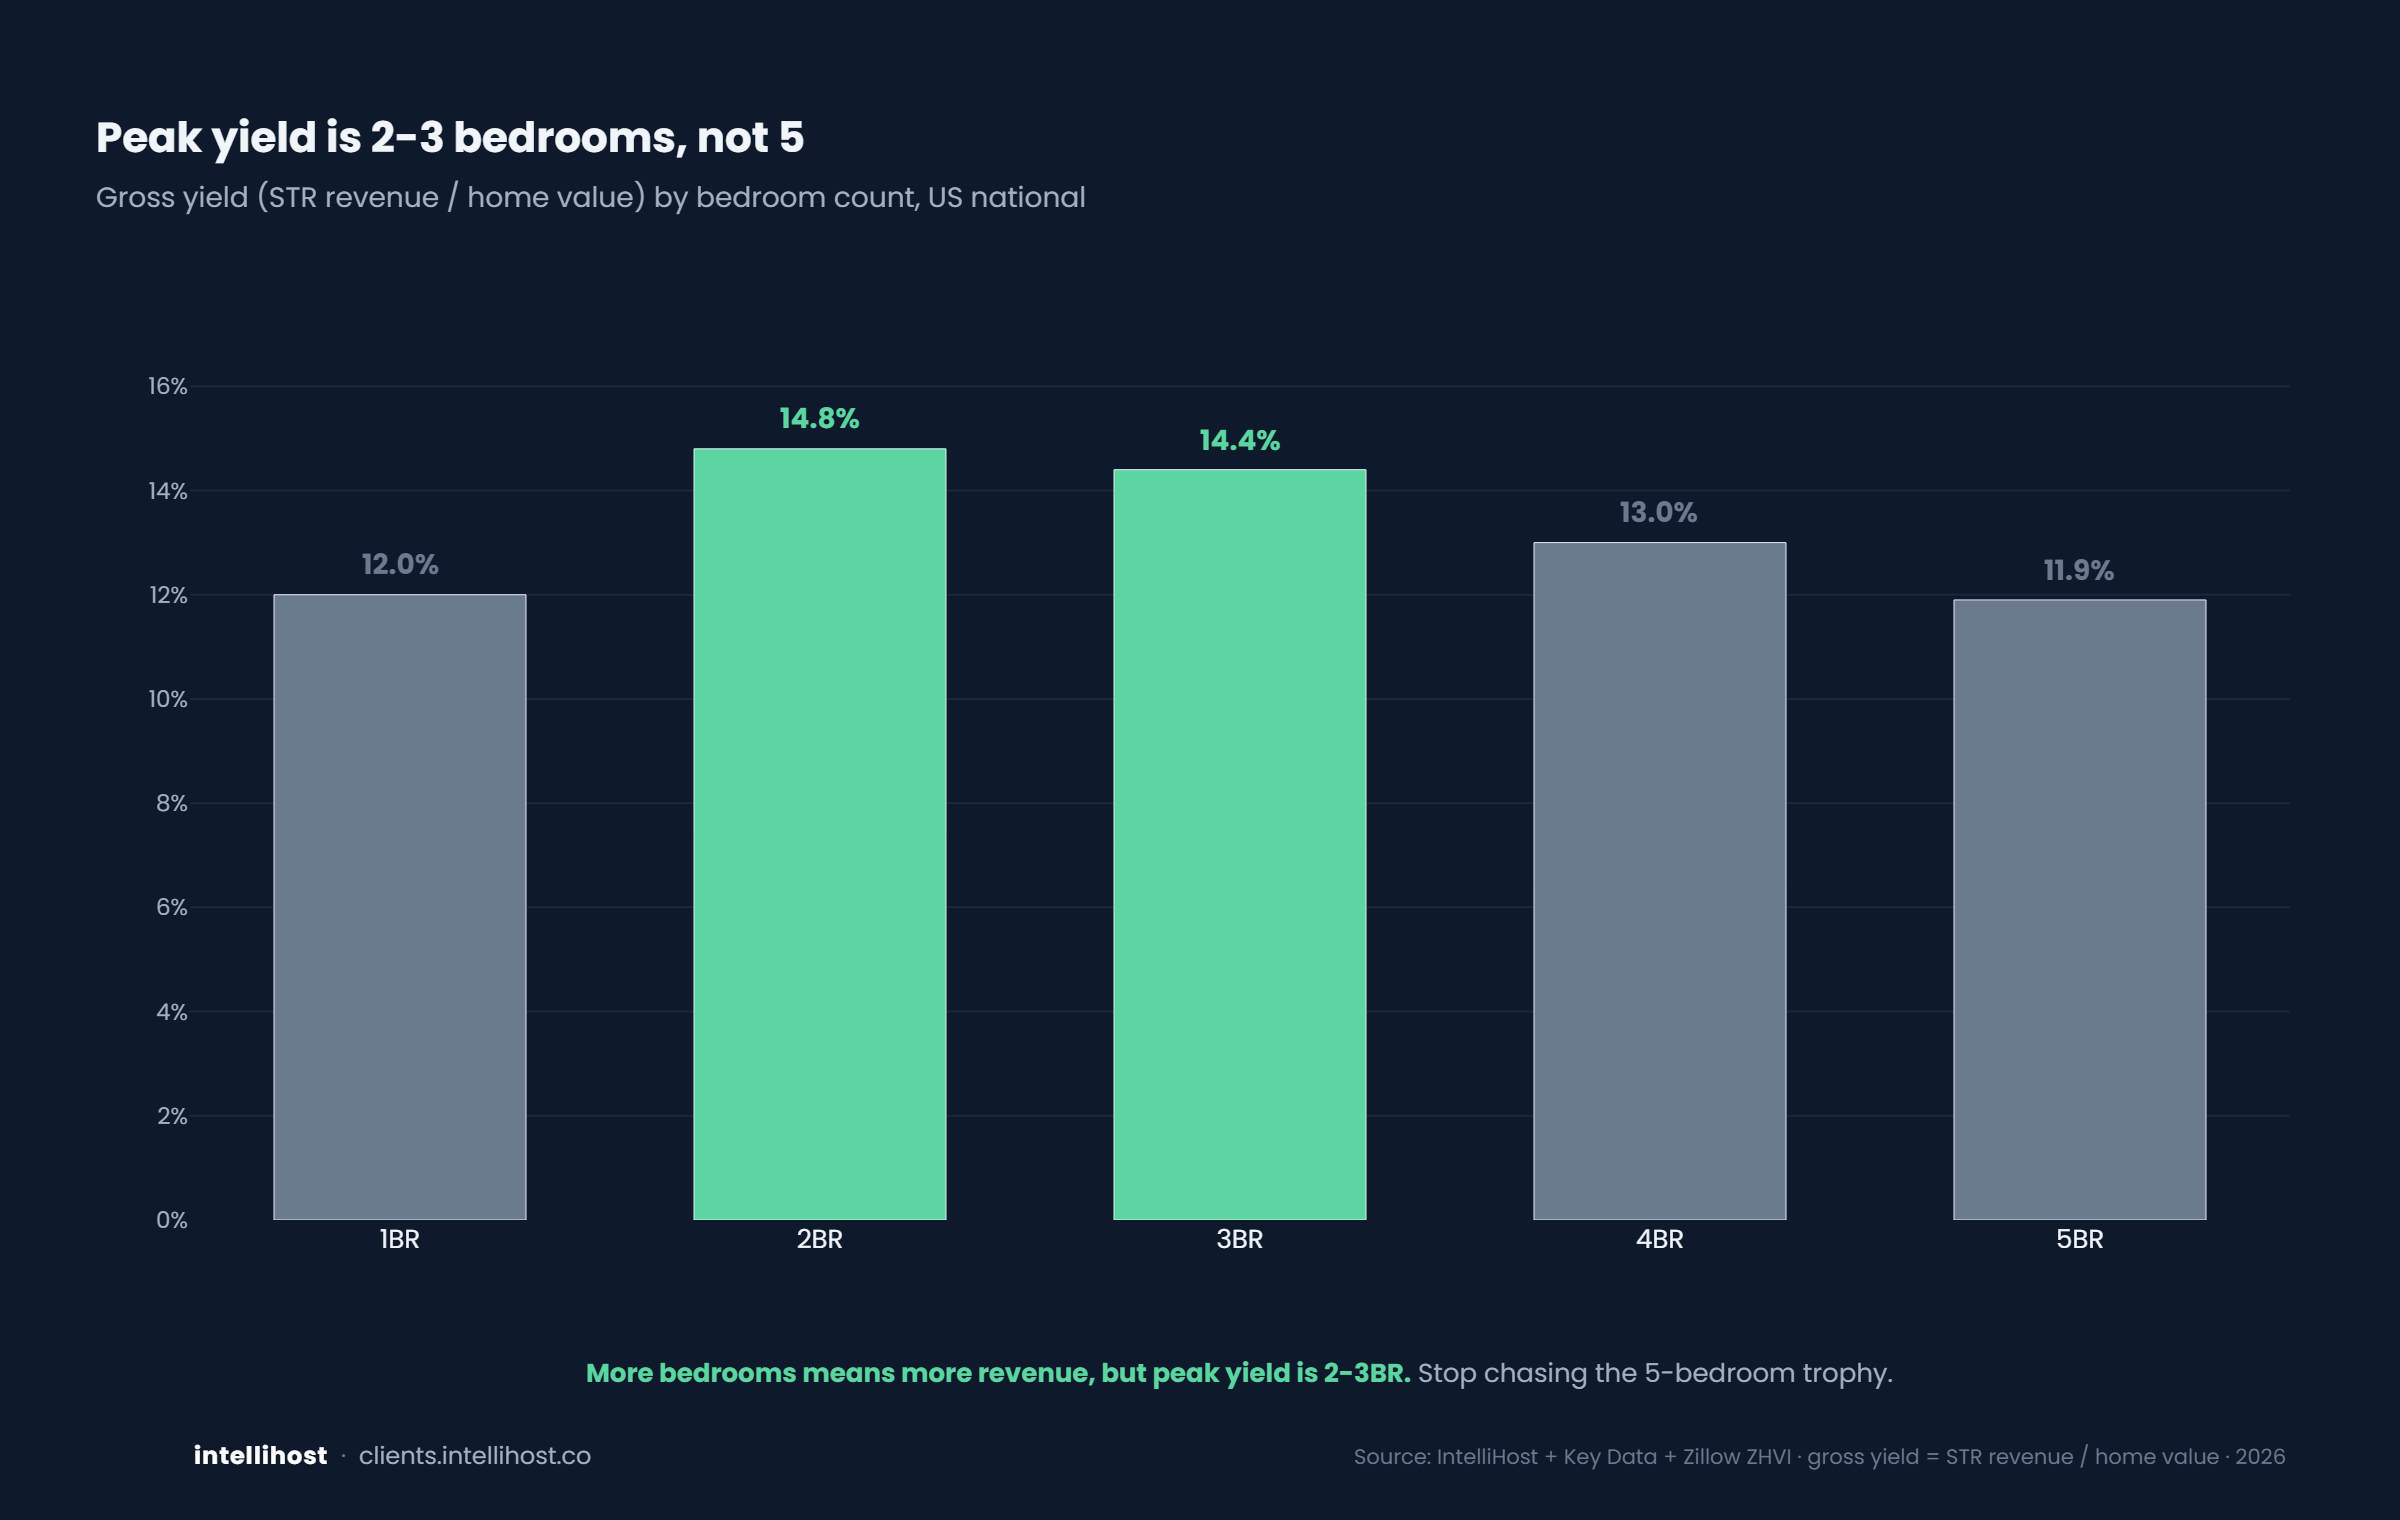
Peak yield is 2-3 bedrooms, not 5
Stop chasing the 5-bedroom trophy.
Listing craft
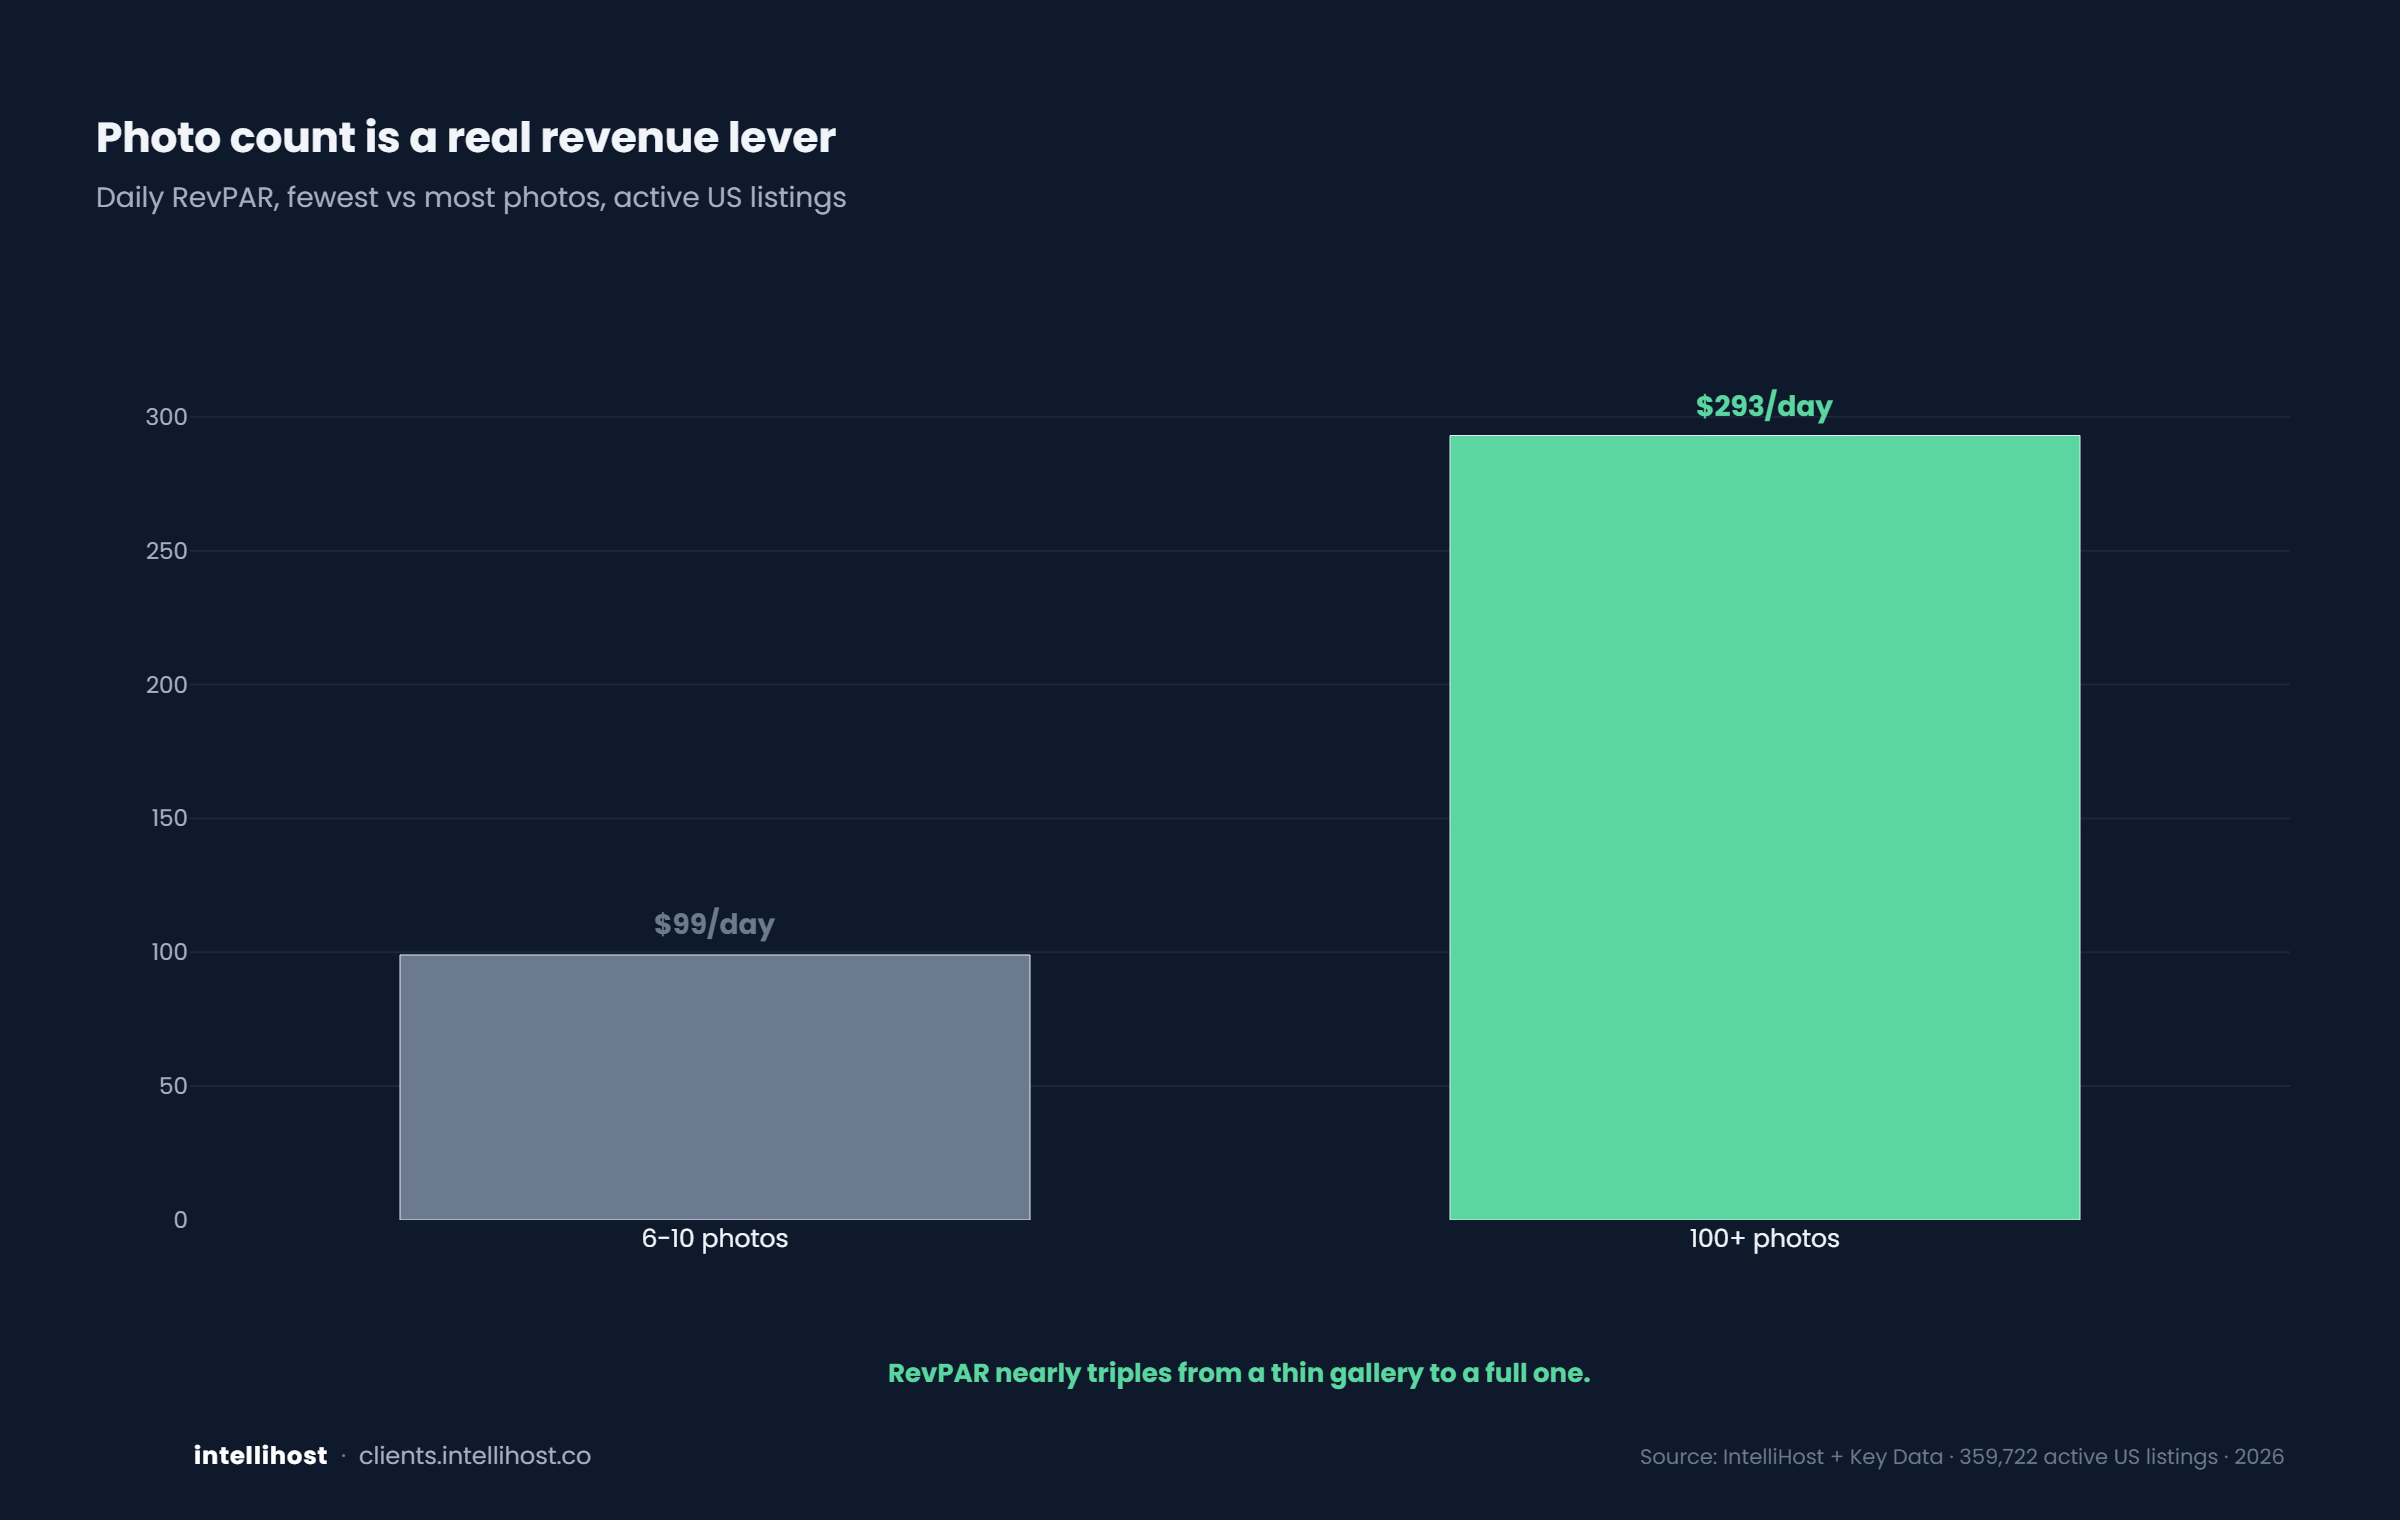
Photo count is a real revenue lever
RevPAR nearly triples with a full gallery.
Pricing
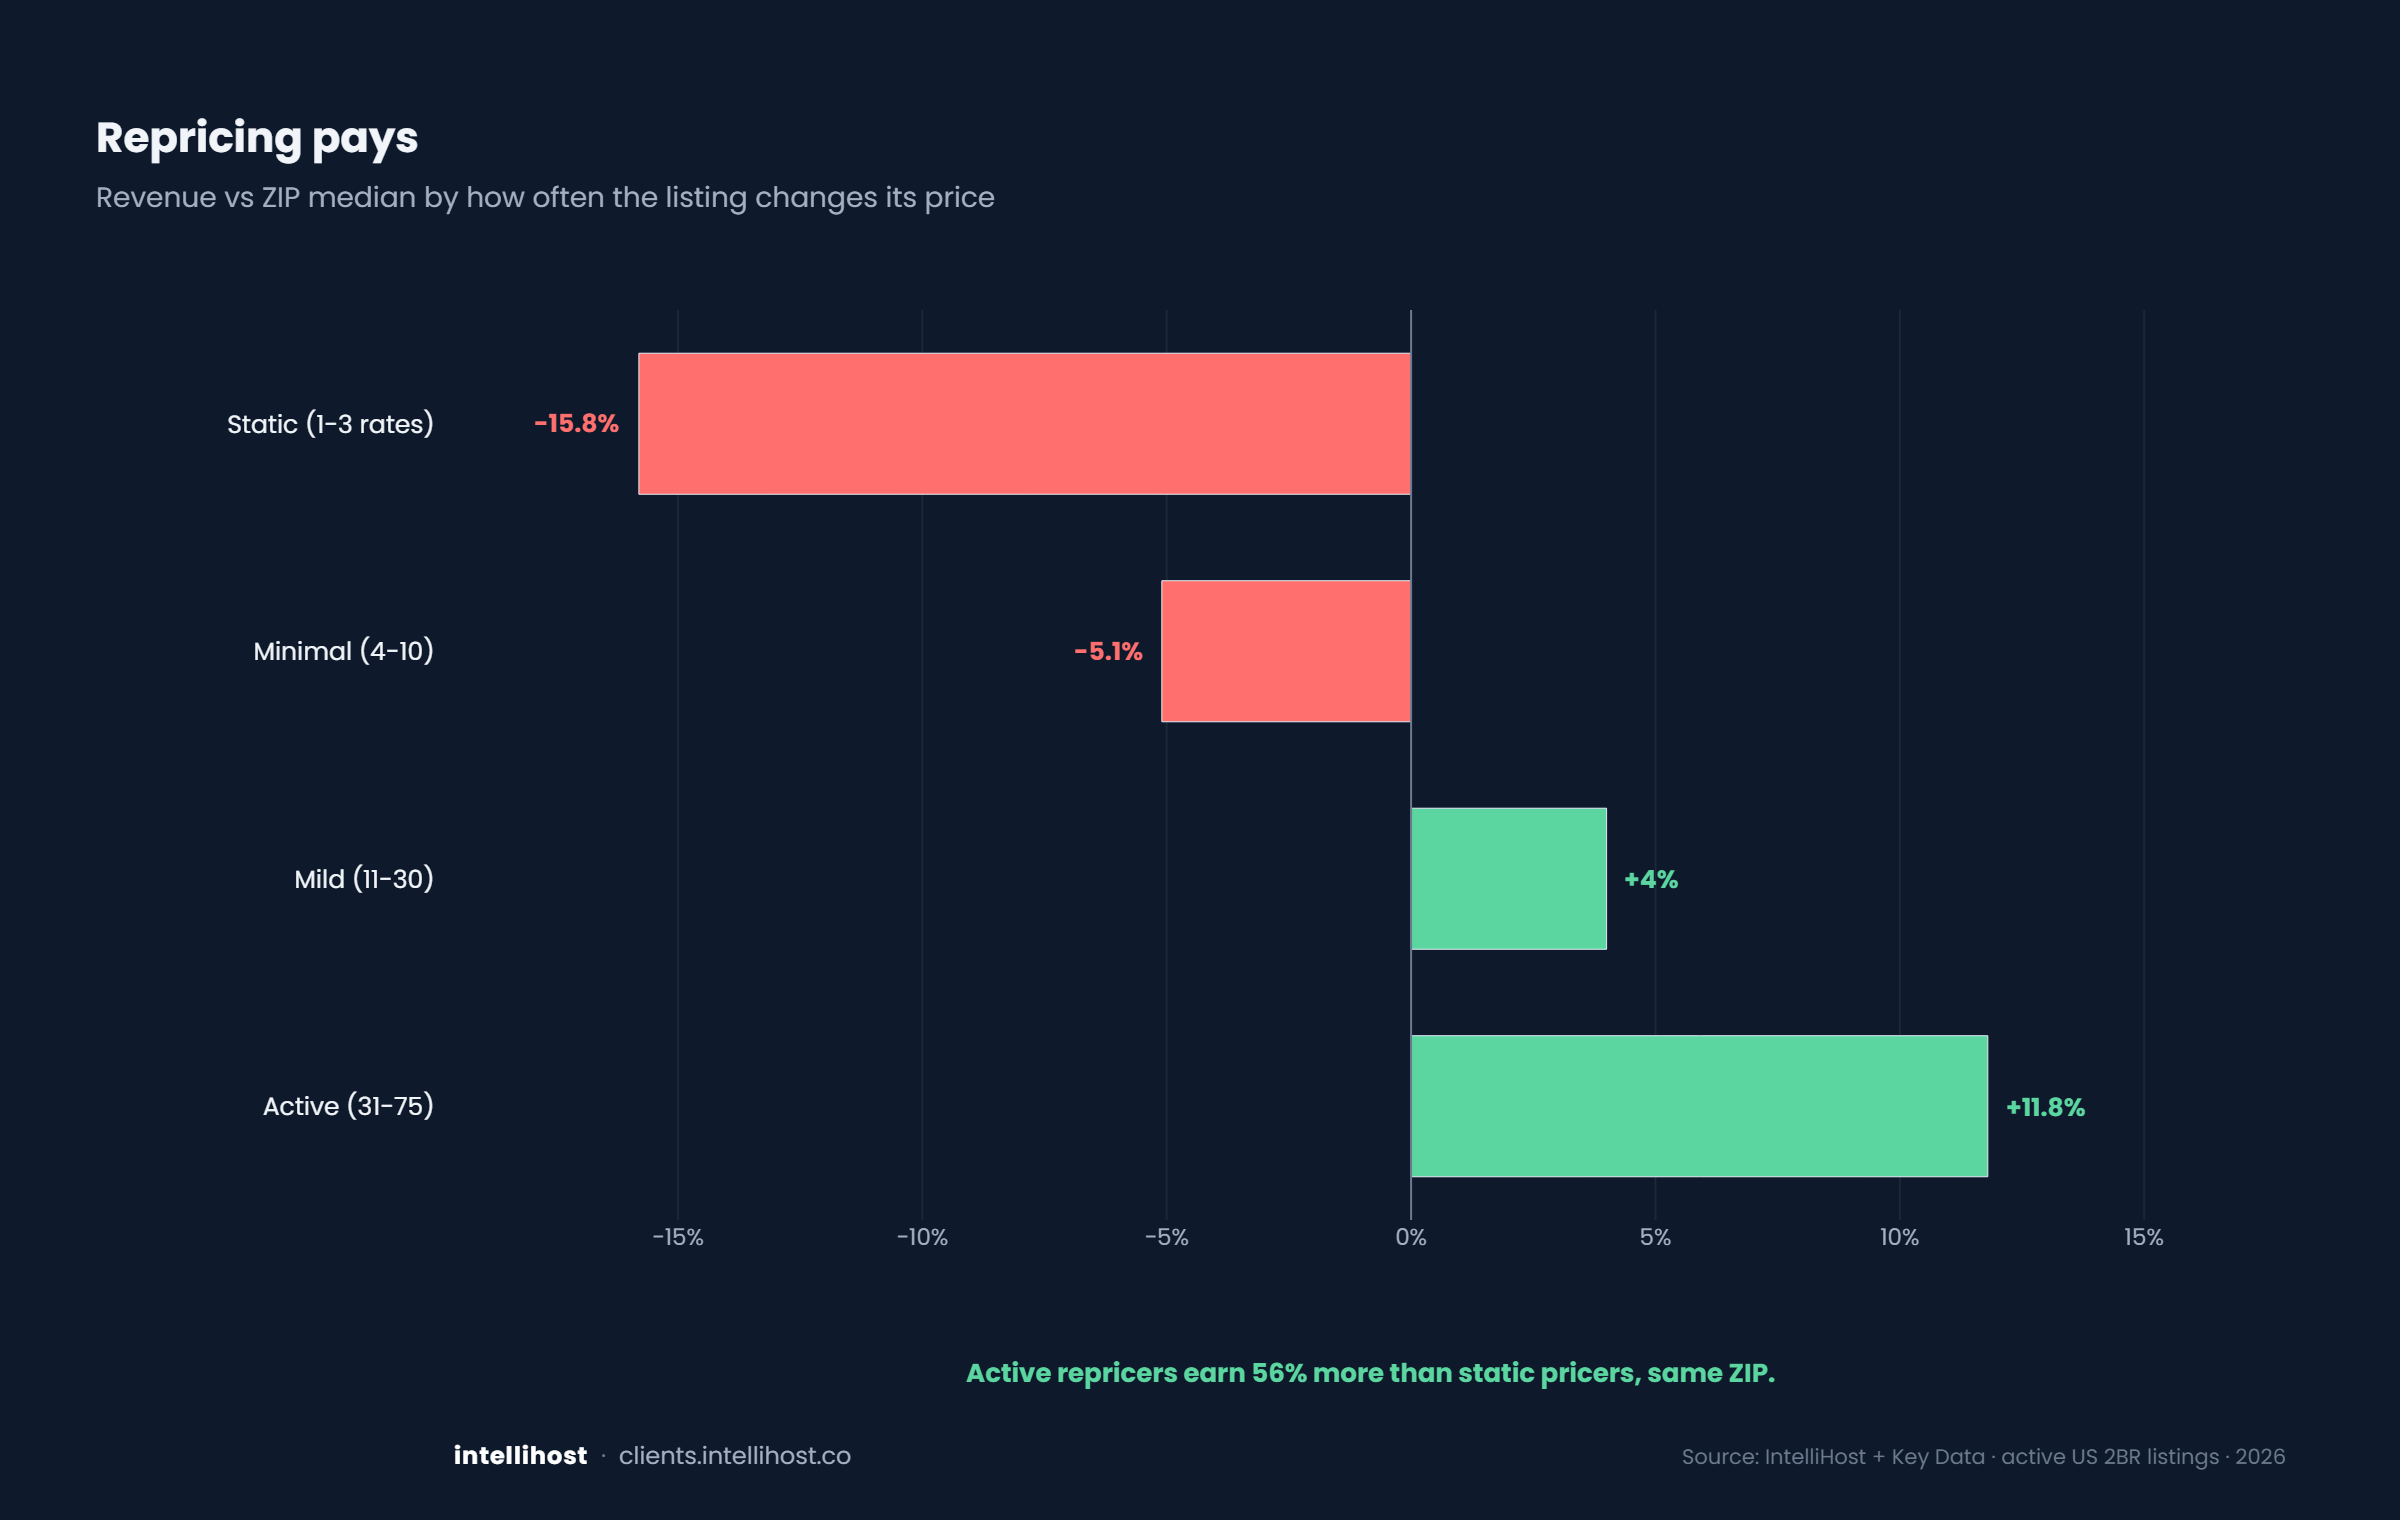
Repricing pays
Static pricers leave 56% on the table.
Reviews
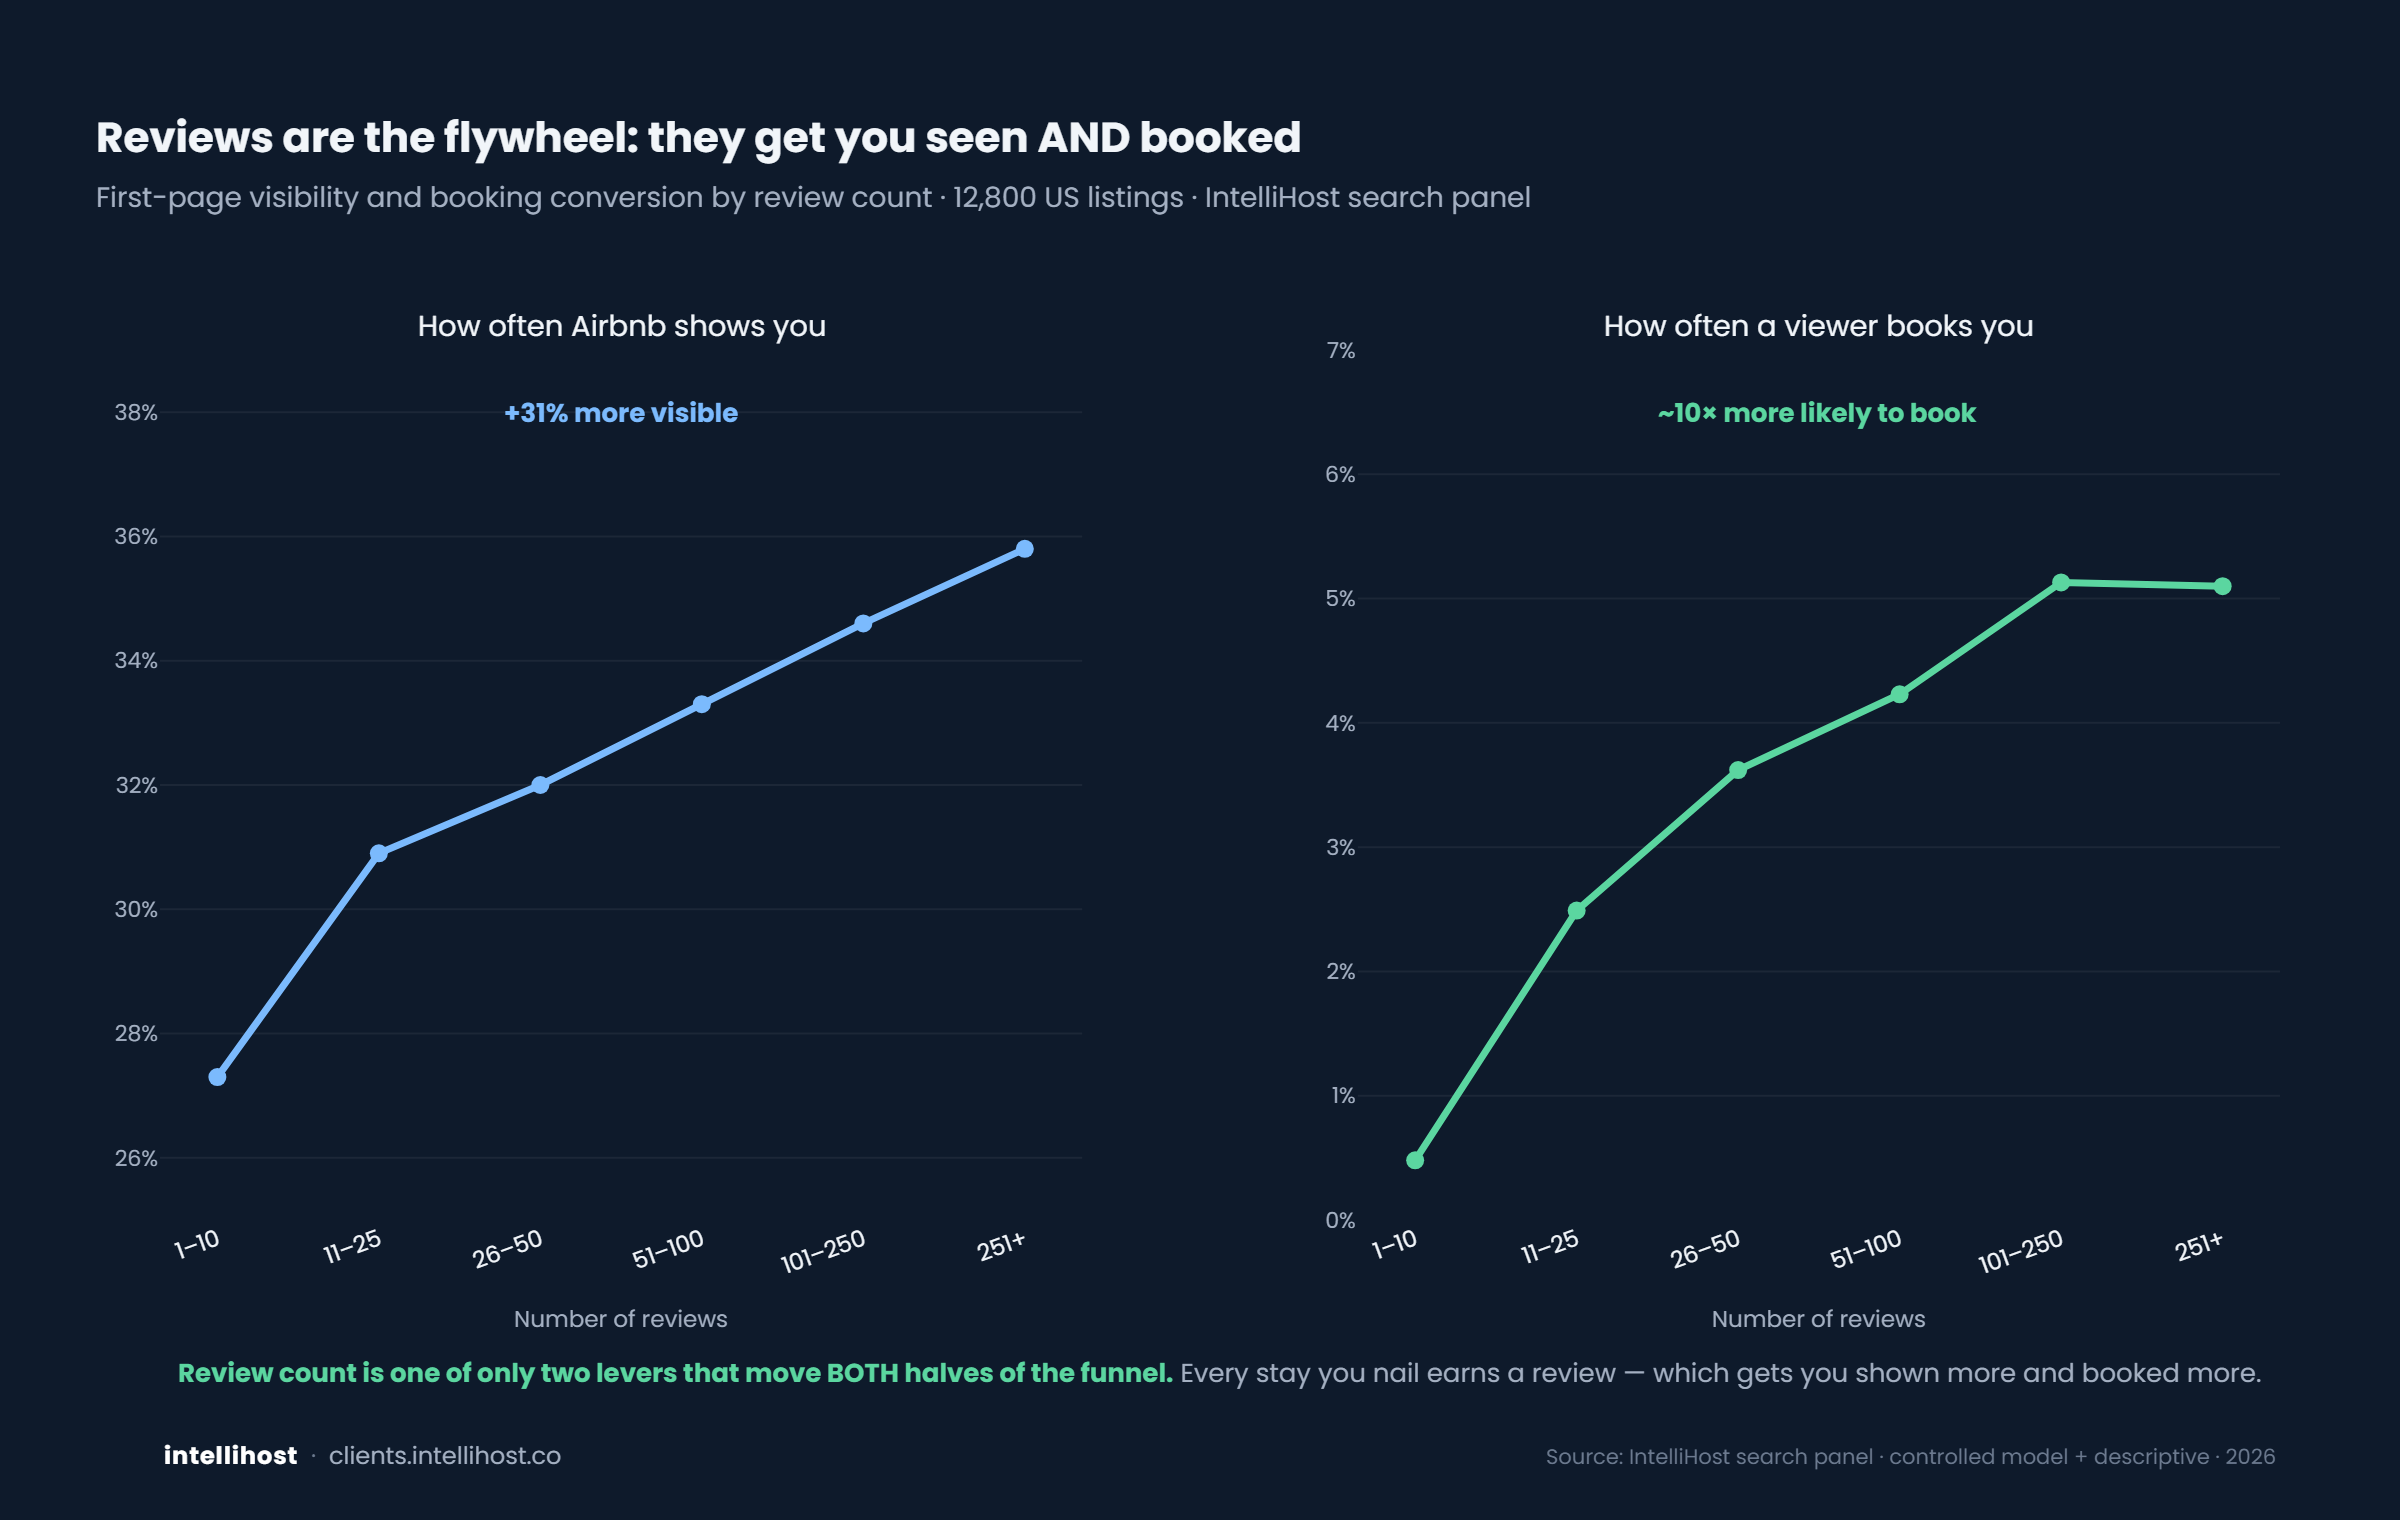
Reviews are the flywheel
The closest thing to a cheat code that exists.
Reviews
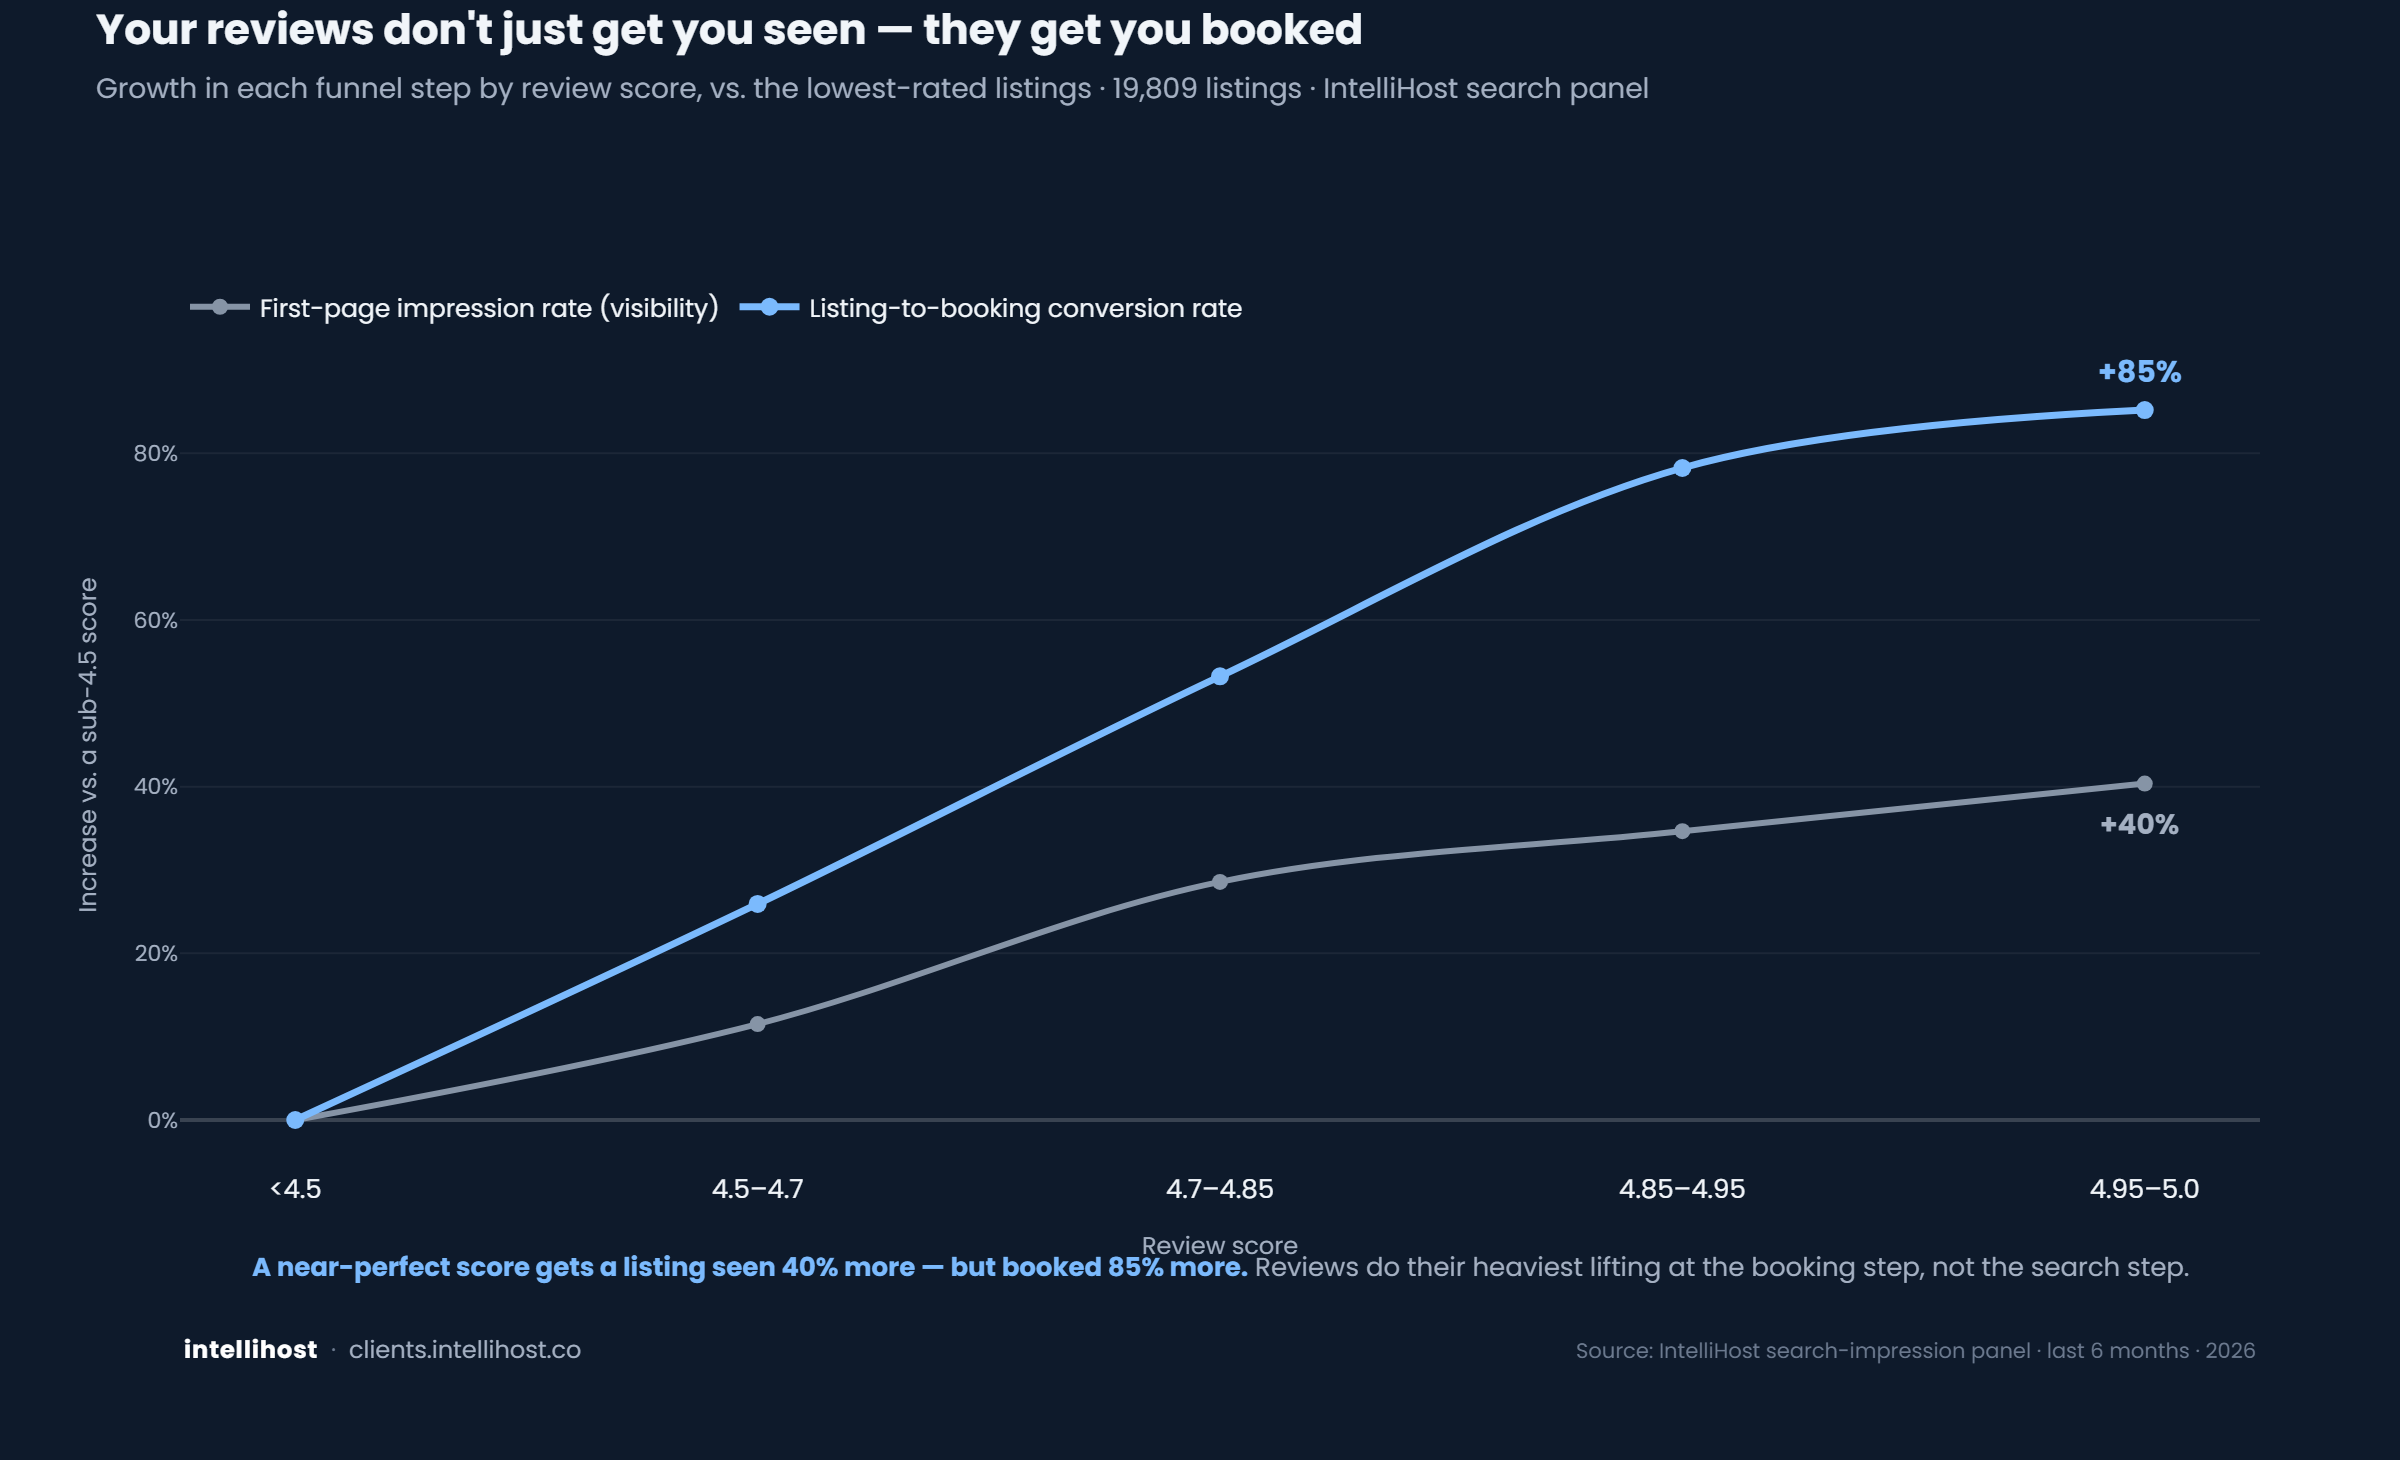
Reviews don't just get you seen, they get you booked
Where in the funnel reviews actually act.
Amenities
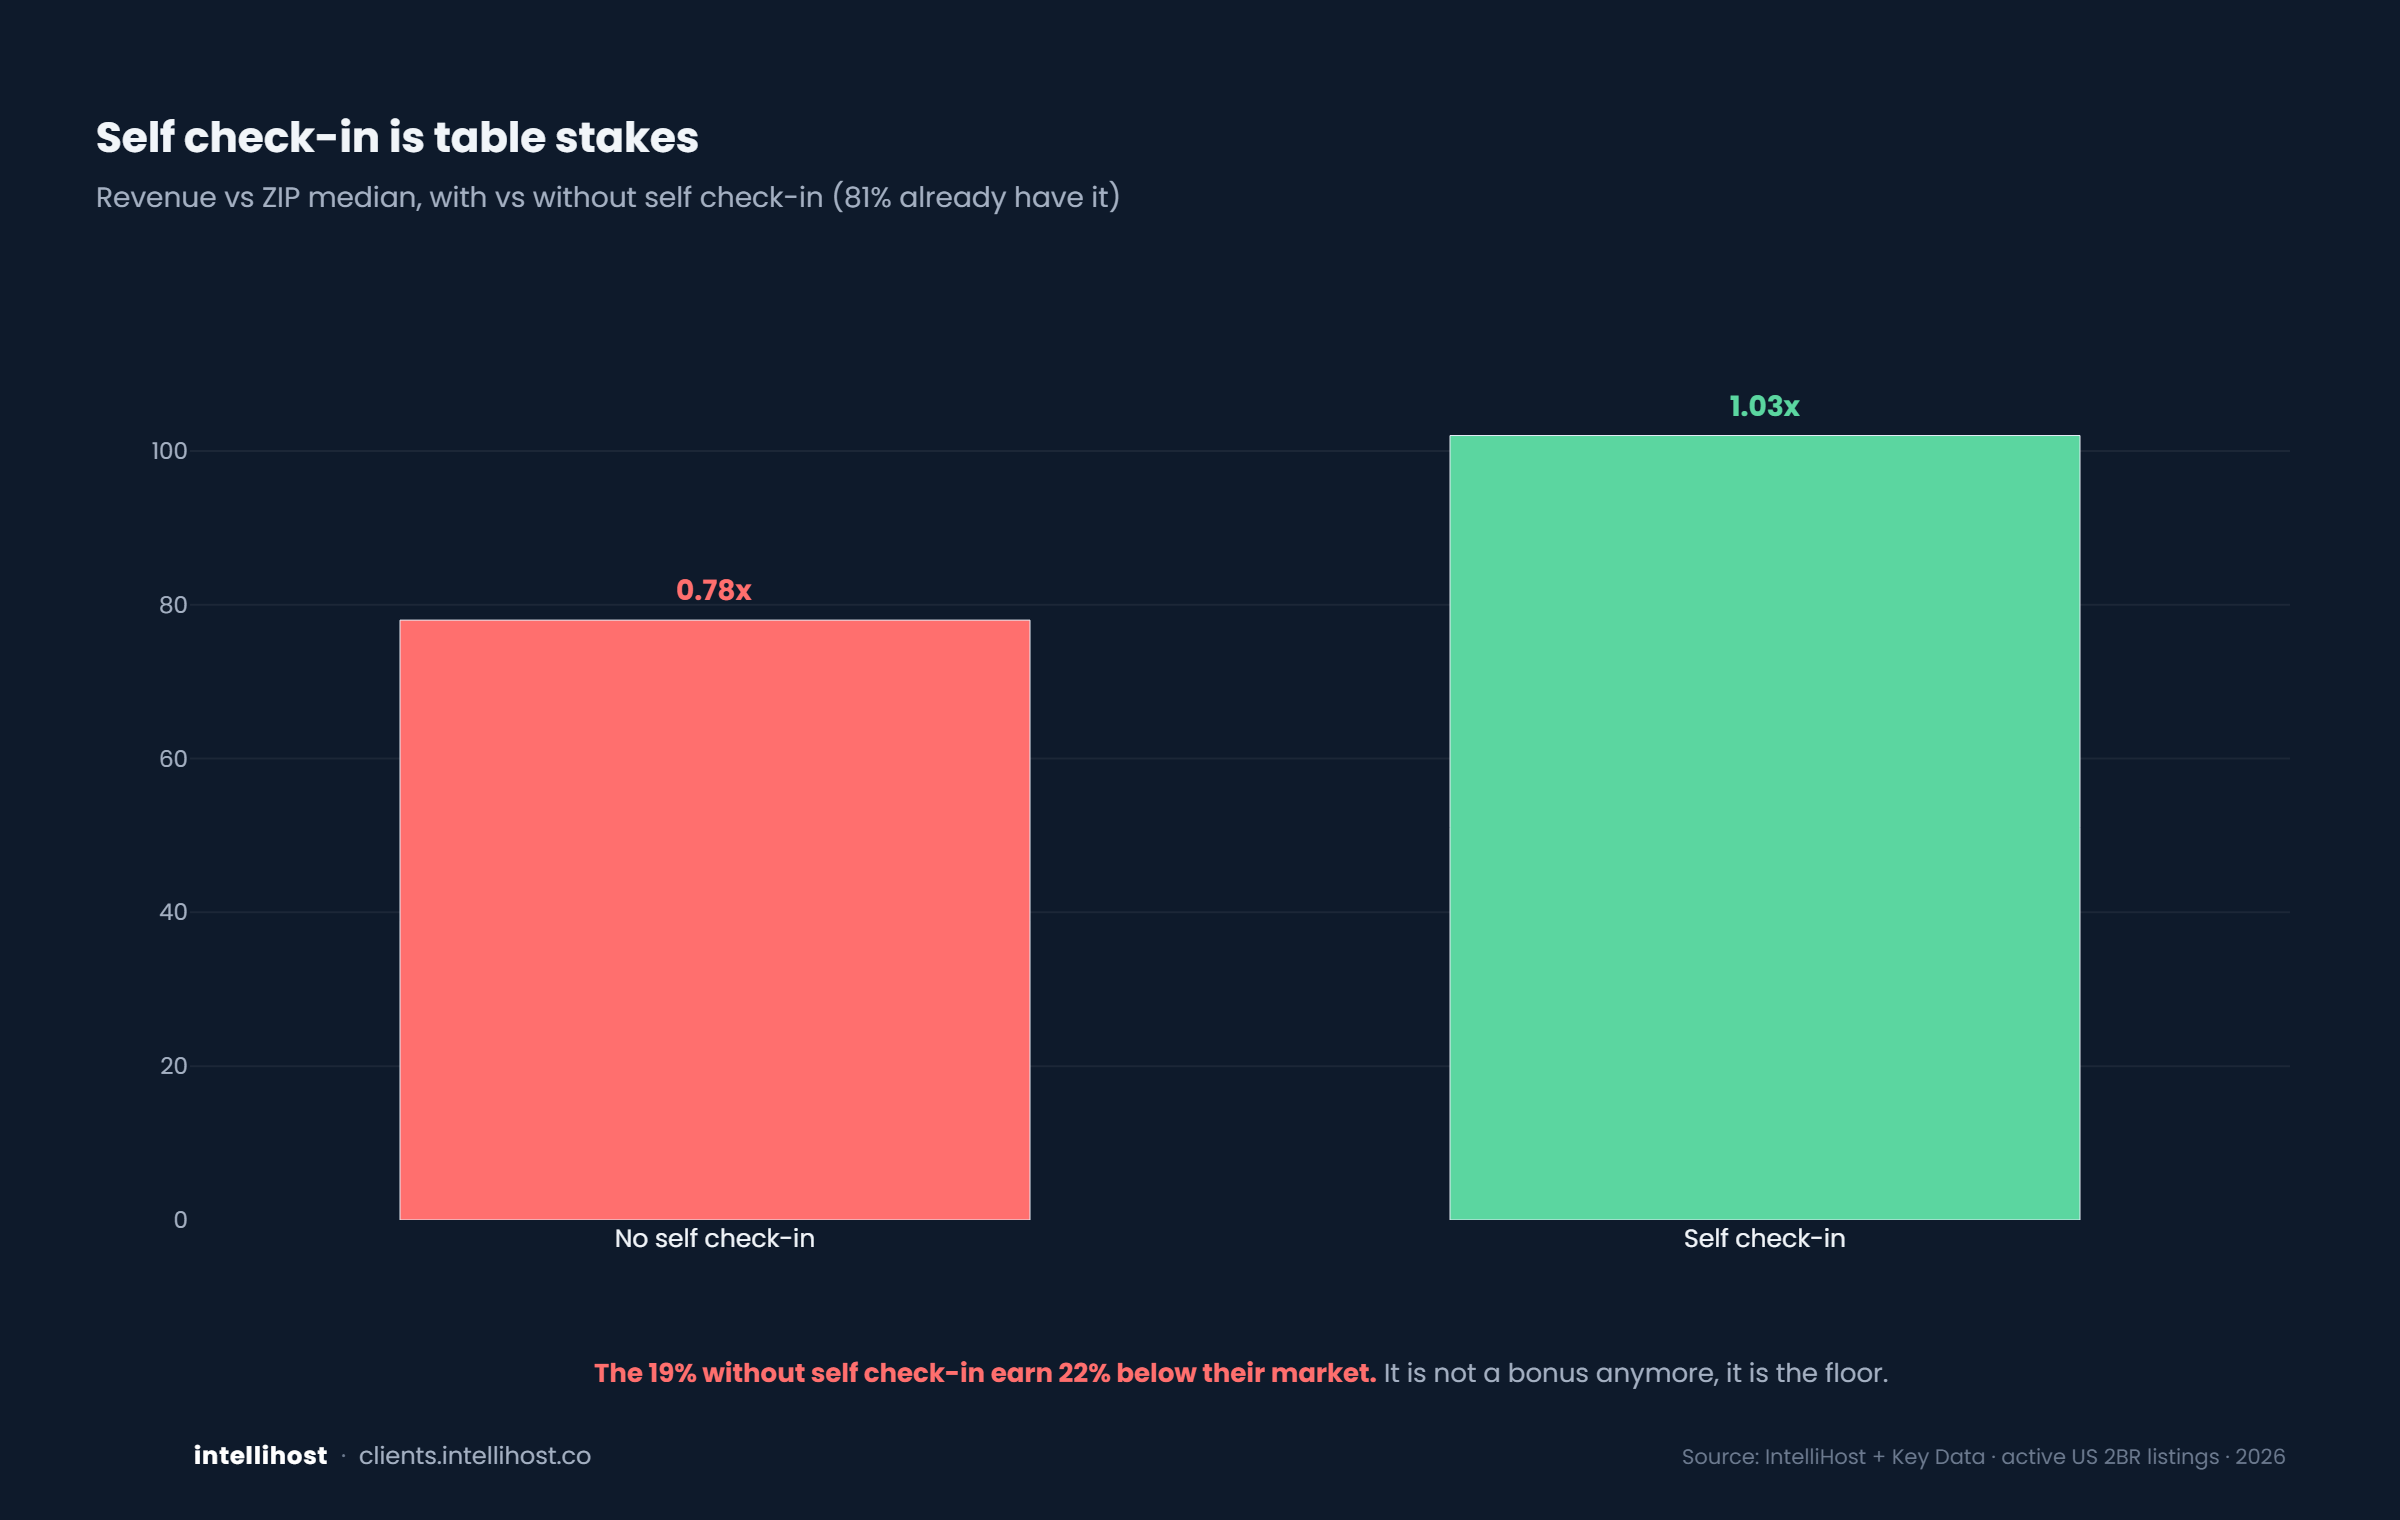
Self check-in is table stakes now
The listings without it are quietly bleeding.
Reviews
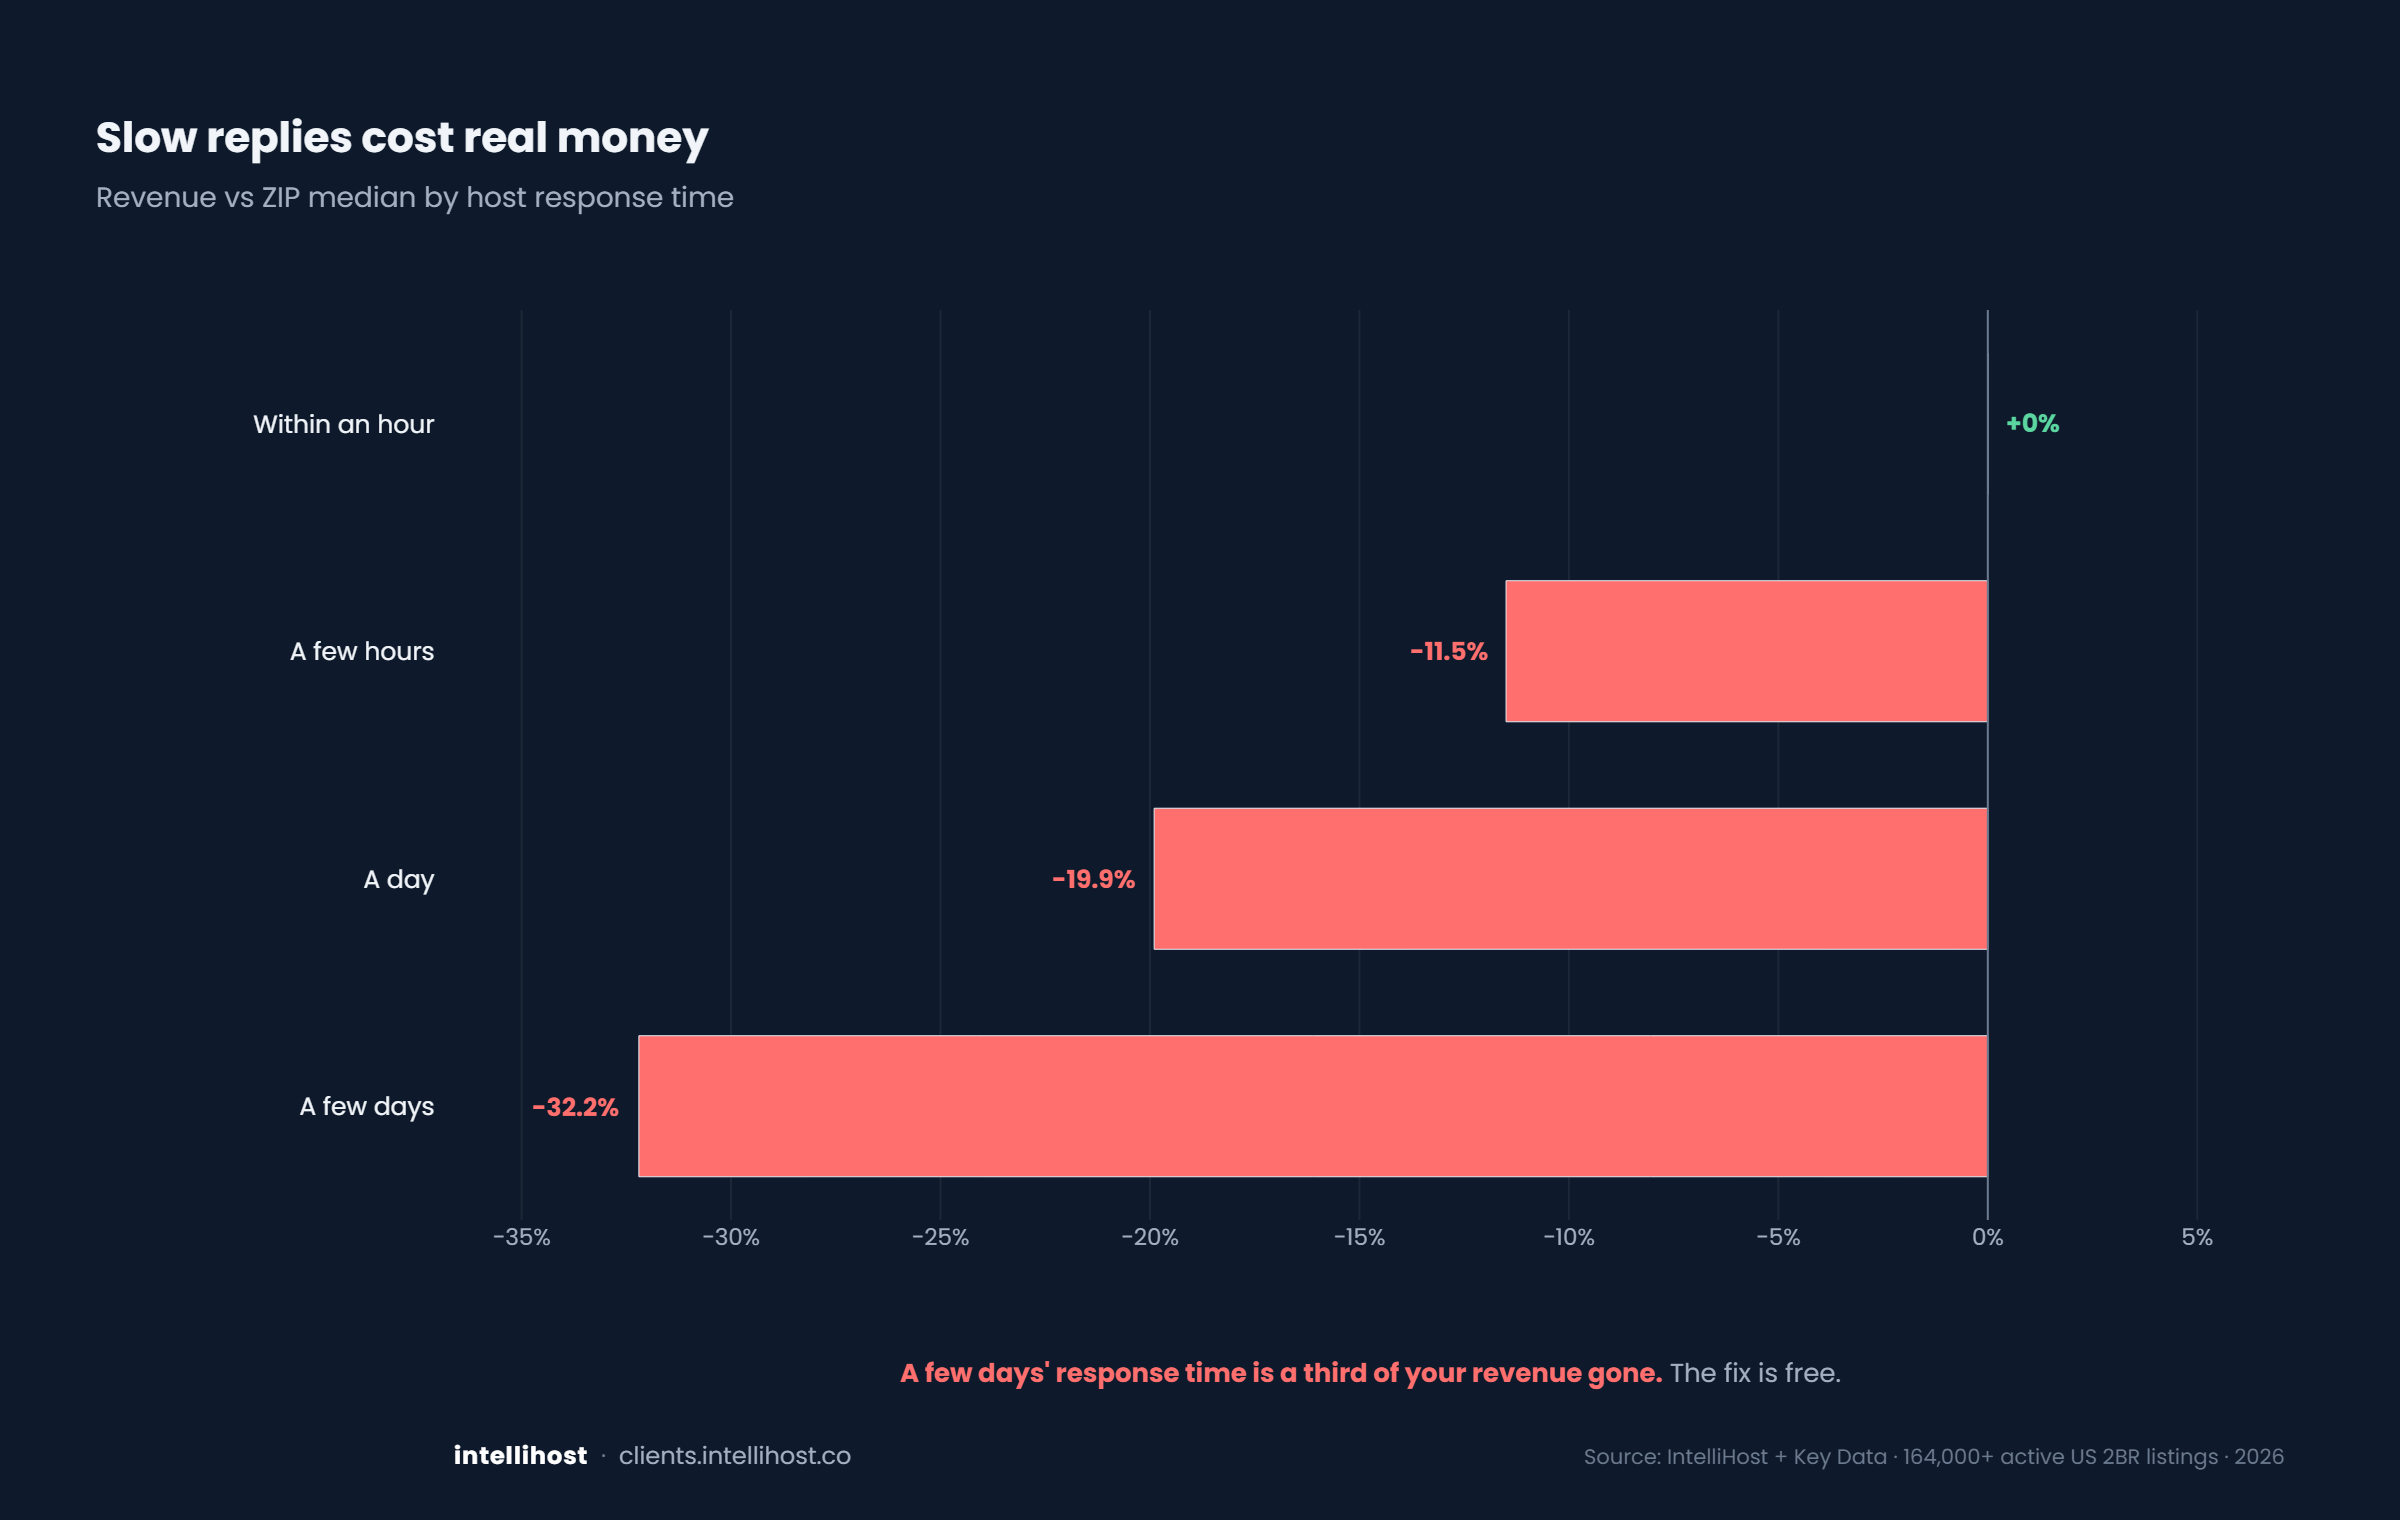
Slow replies cost real money
And the fix is free.
Pricing
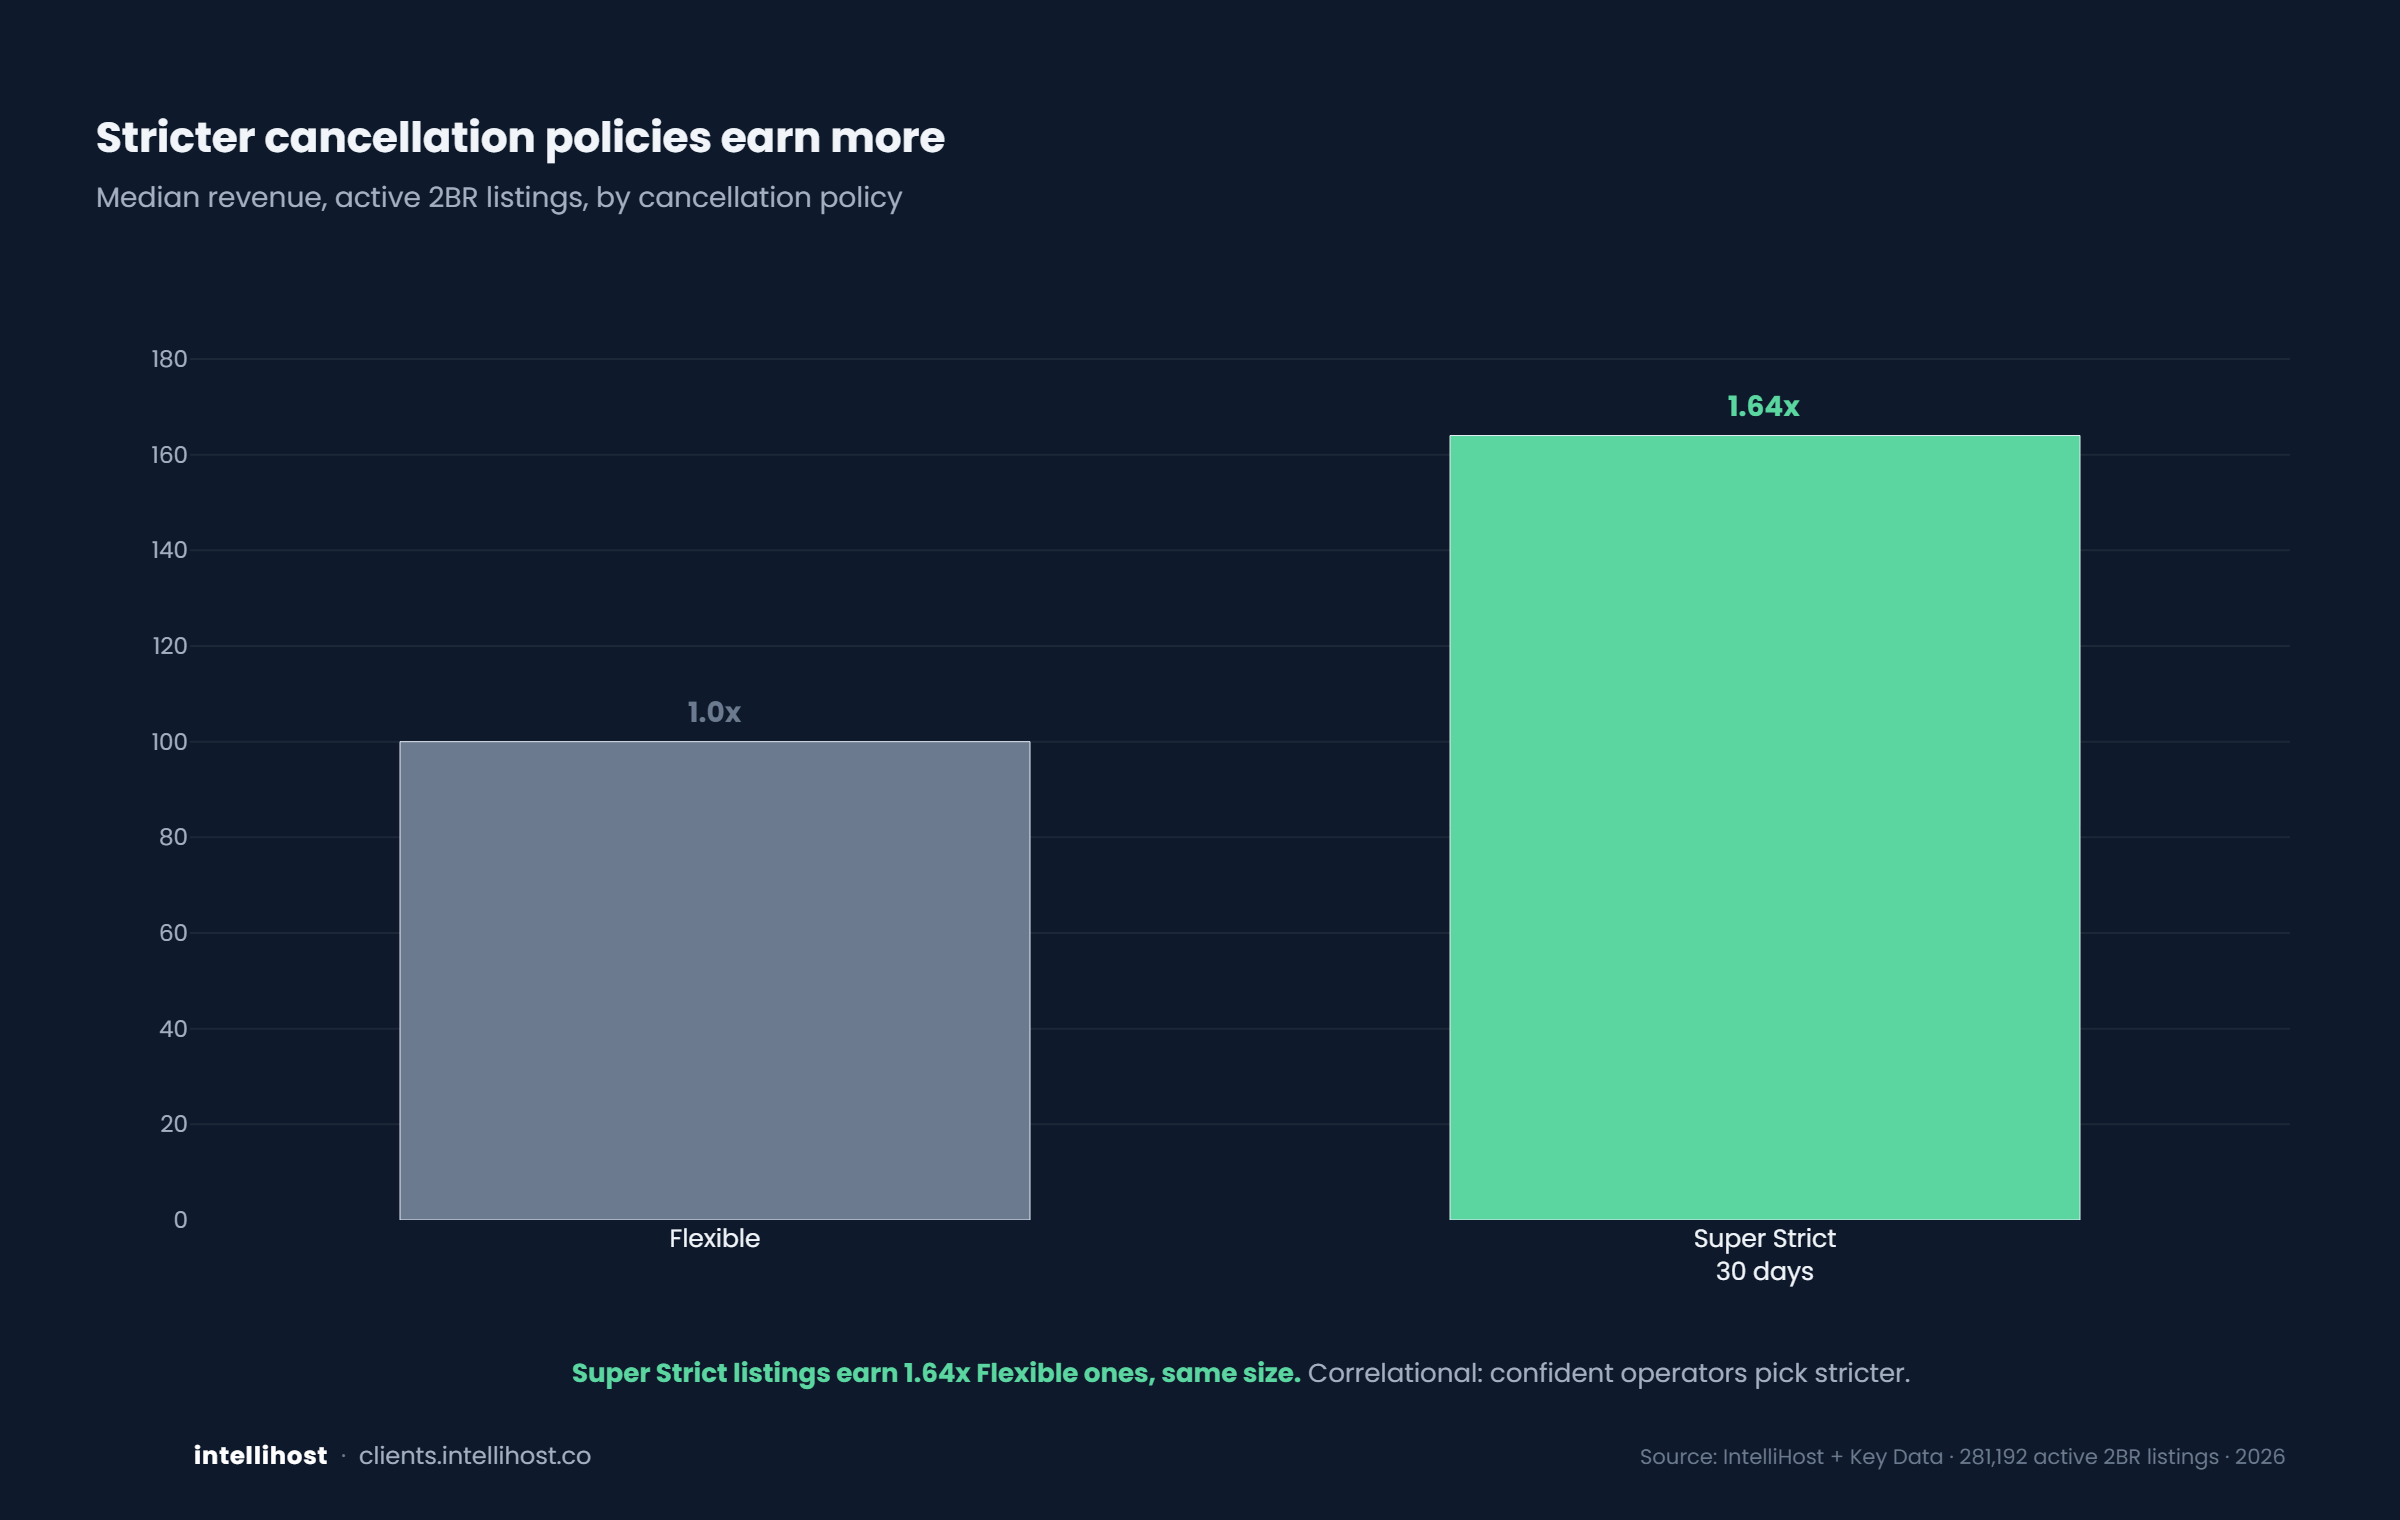
Stricter cancellation policies earn more
The trade-off runs in your favor.
Reviews
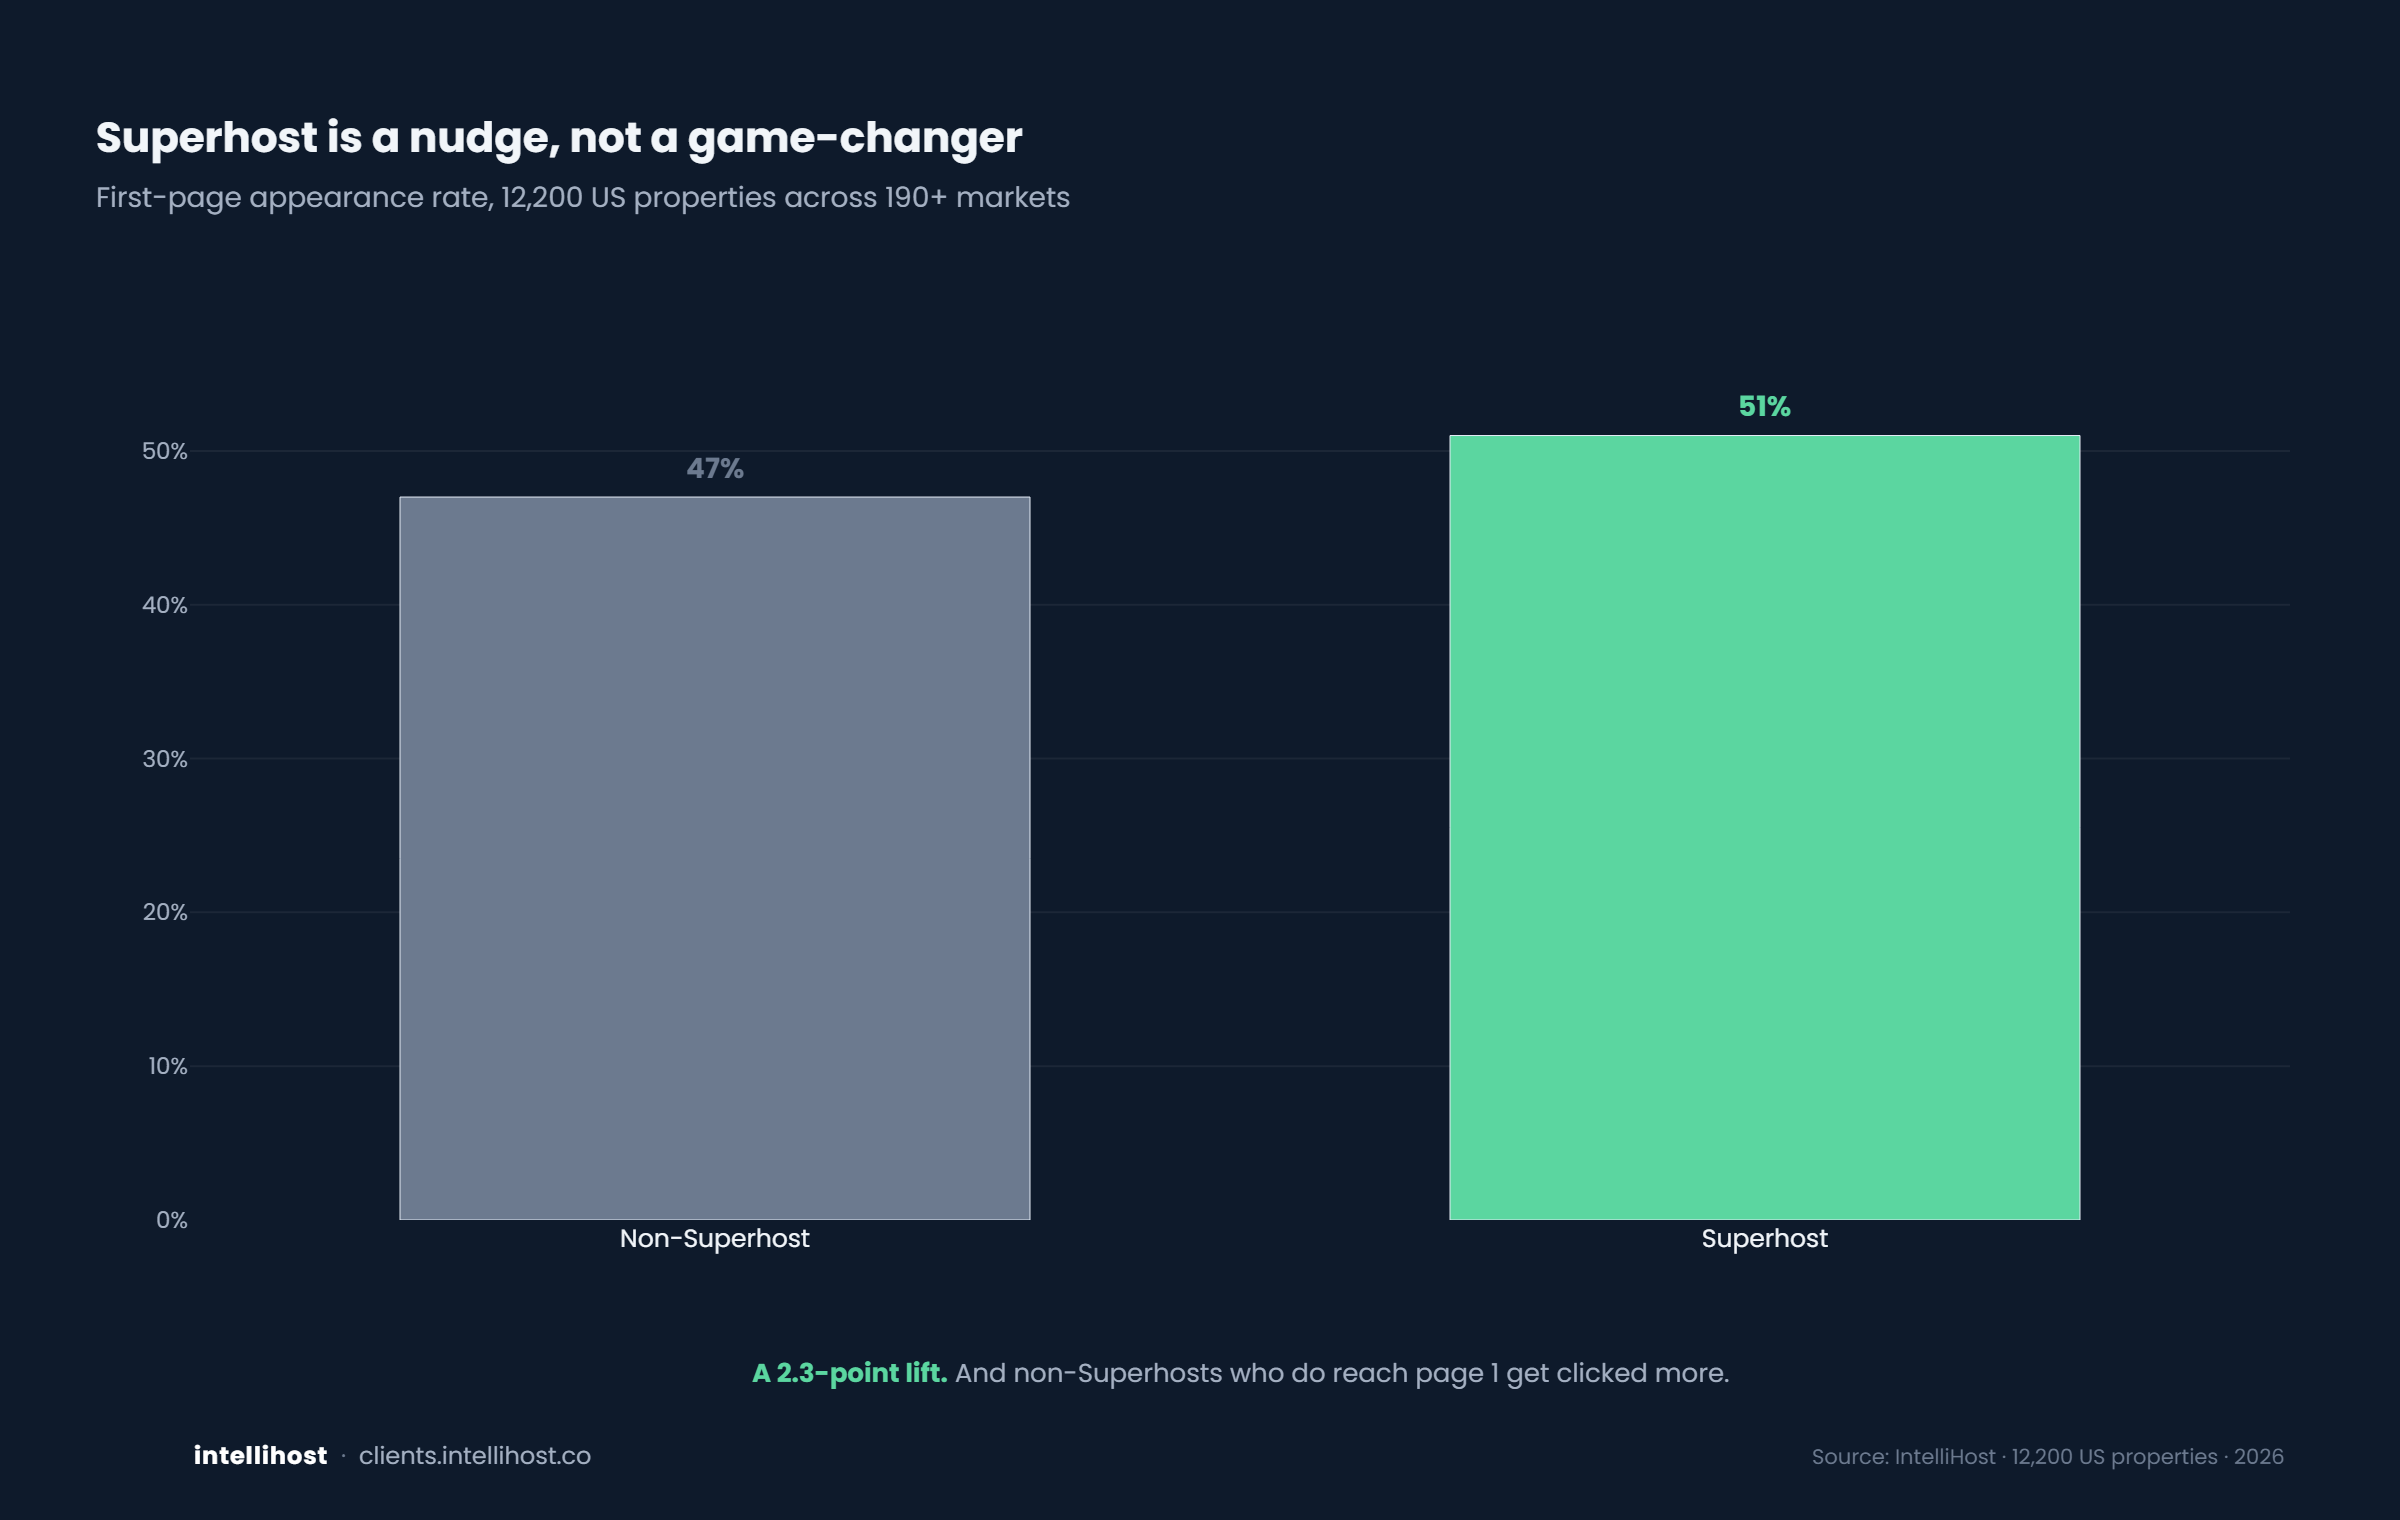
Superhost is a nudge, not a game-changer
The badge does less than you think.
Amenities
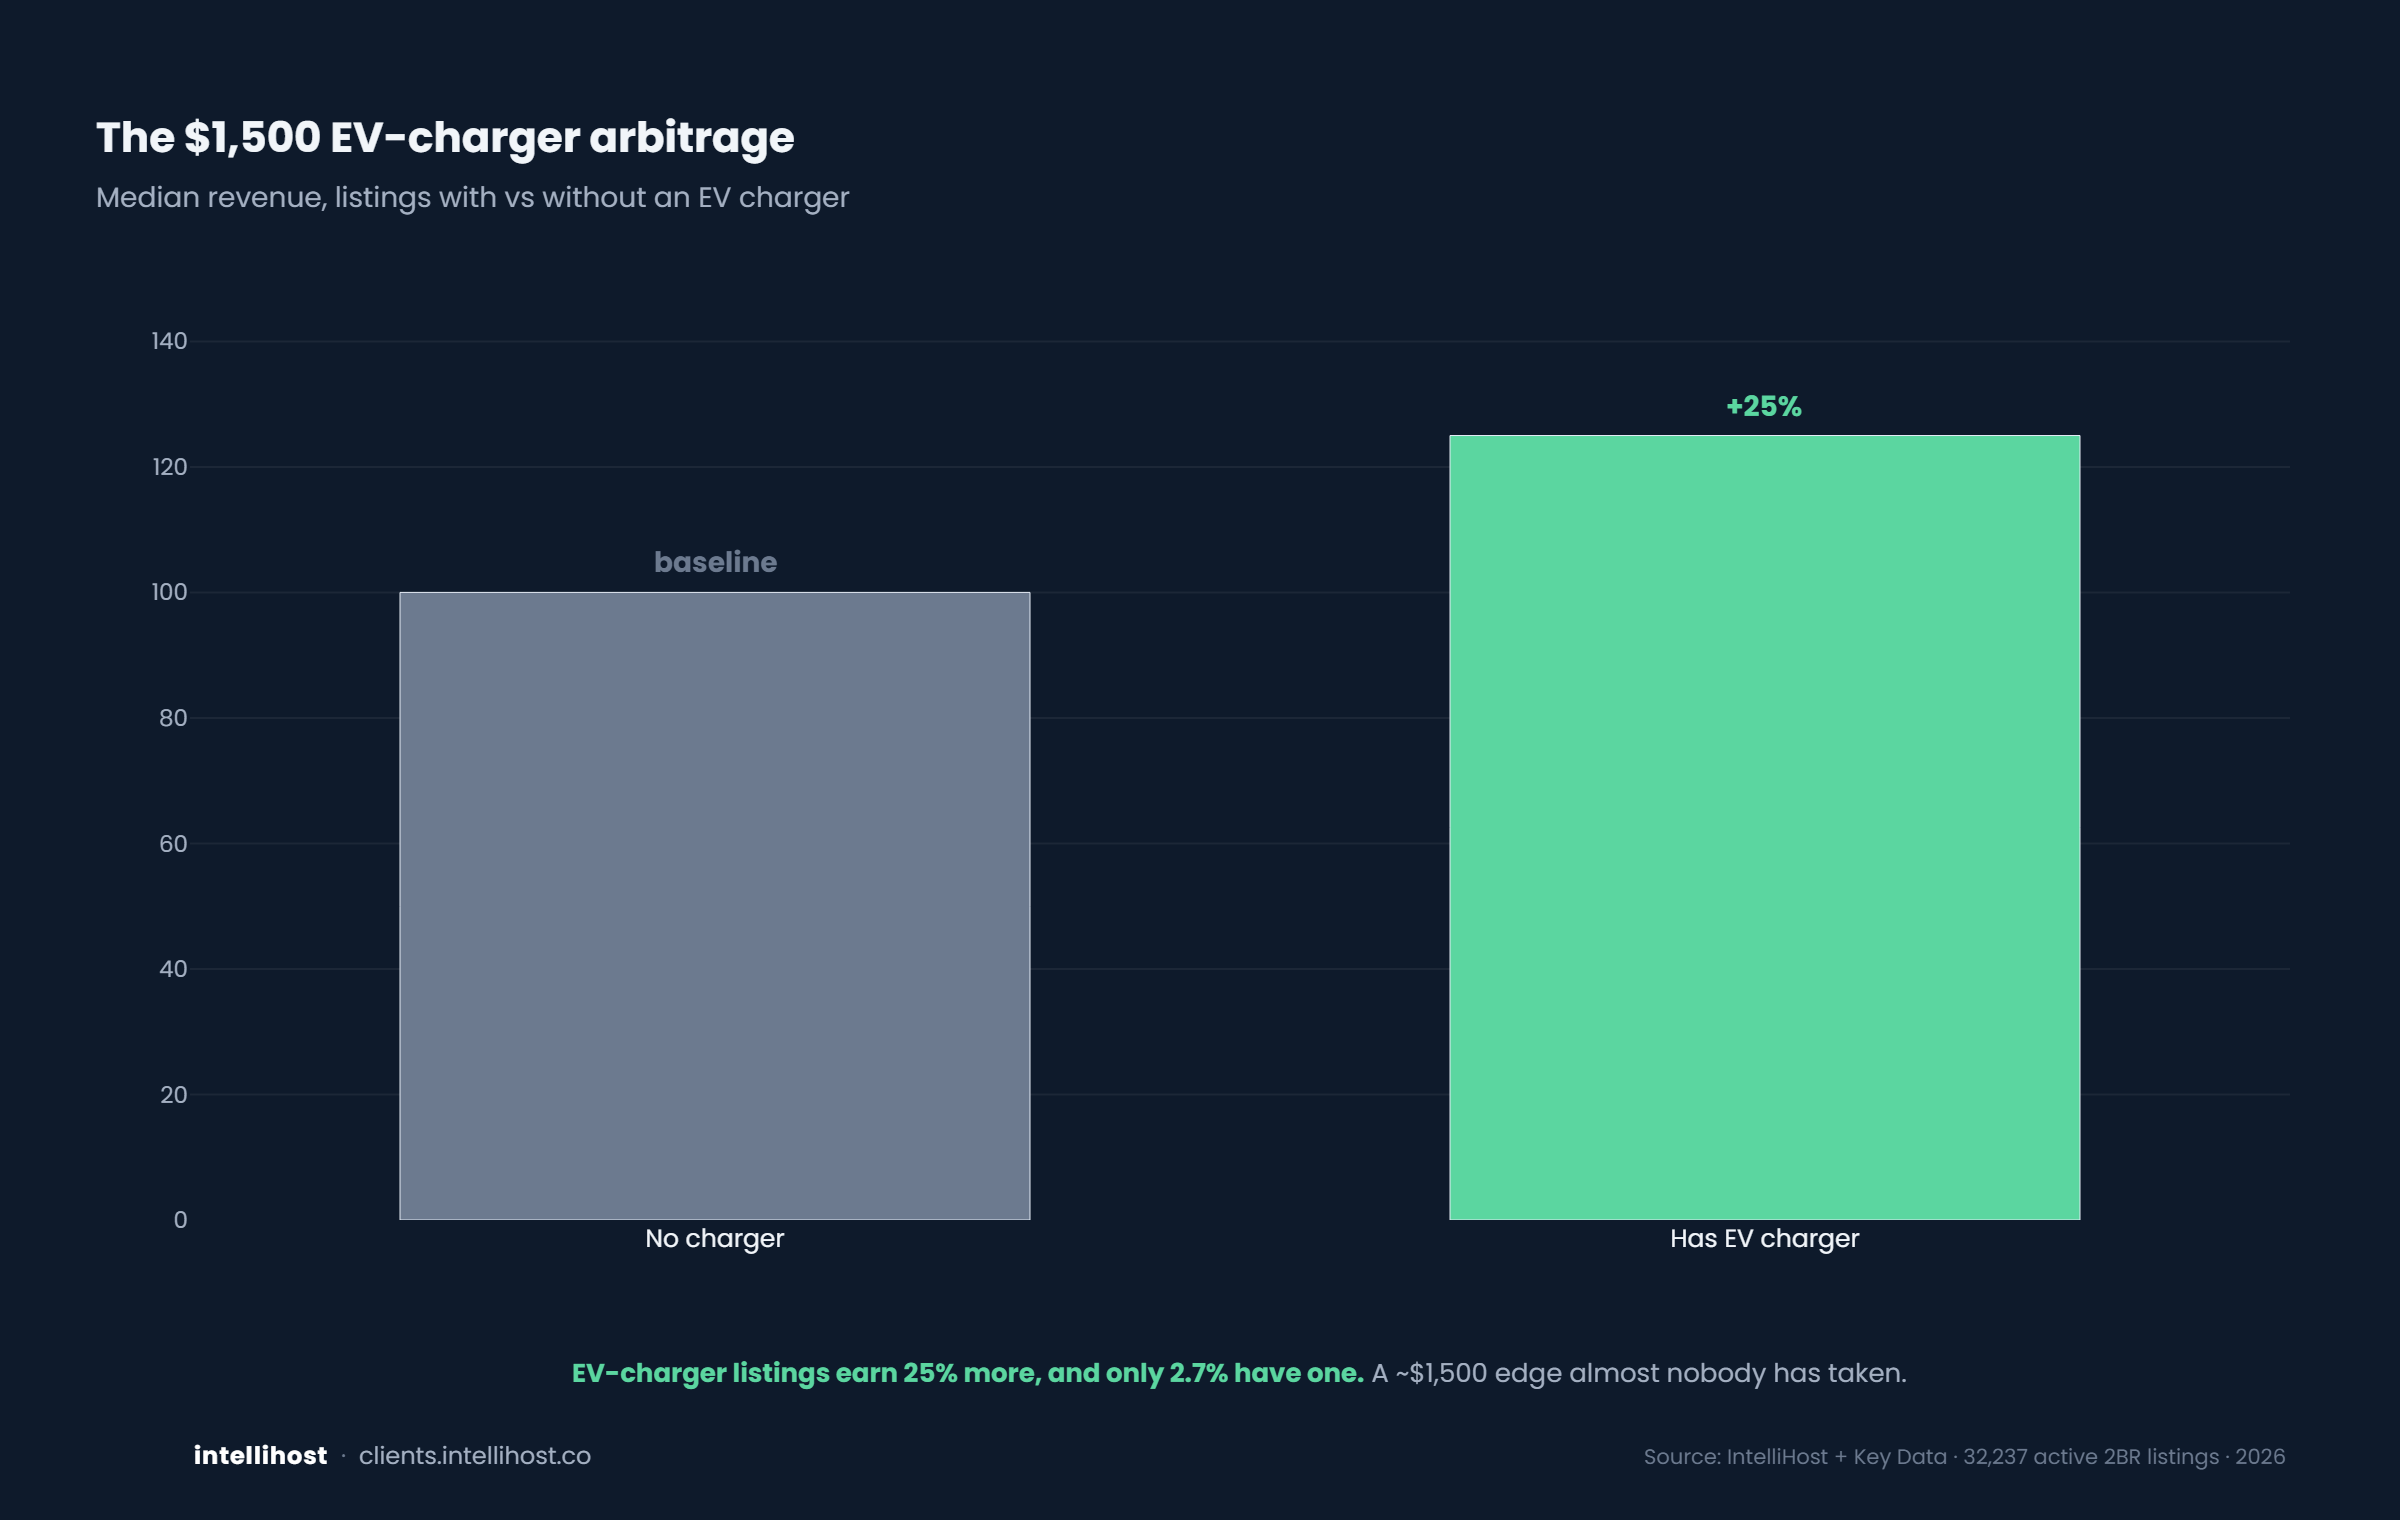
The $1,500 EV-charger arbitrage
One amenity almost nobody has installed pays 25%.
Reviews
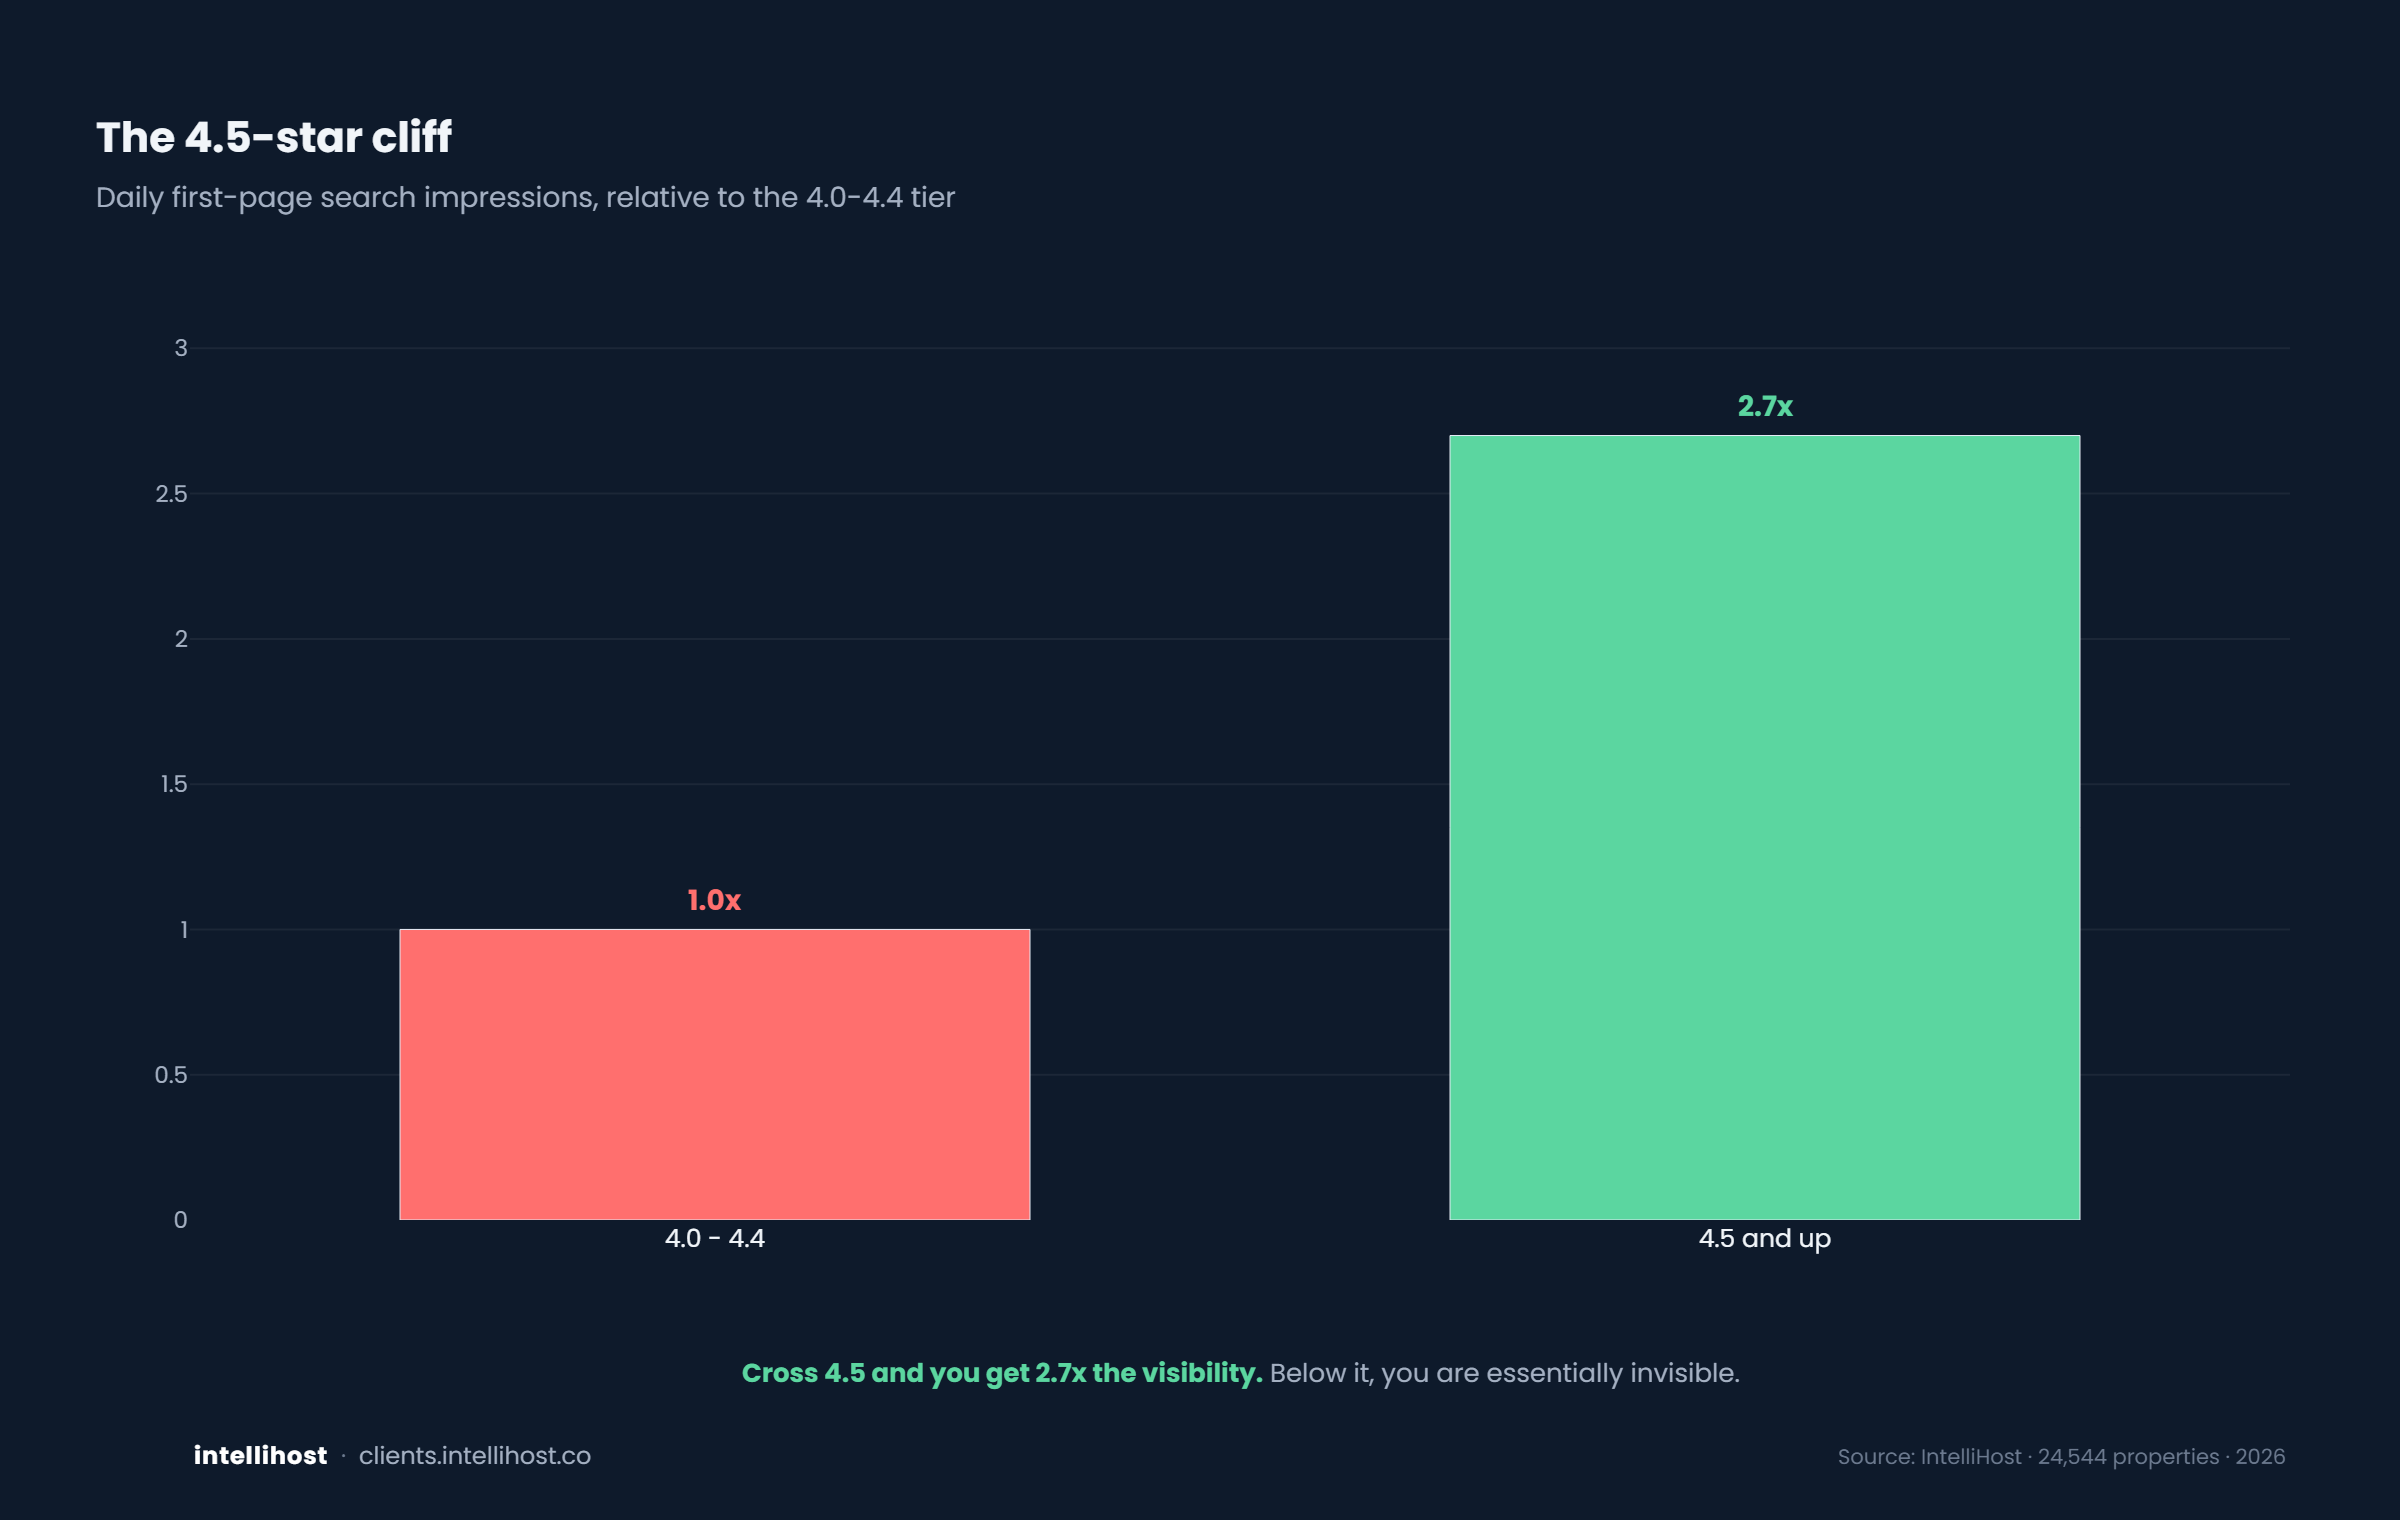
The 4.5-star cliff
Below 4.5, you are essentially invisible.
Reviews
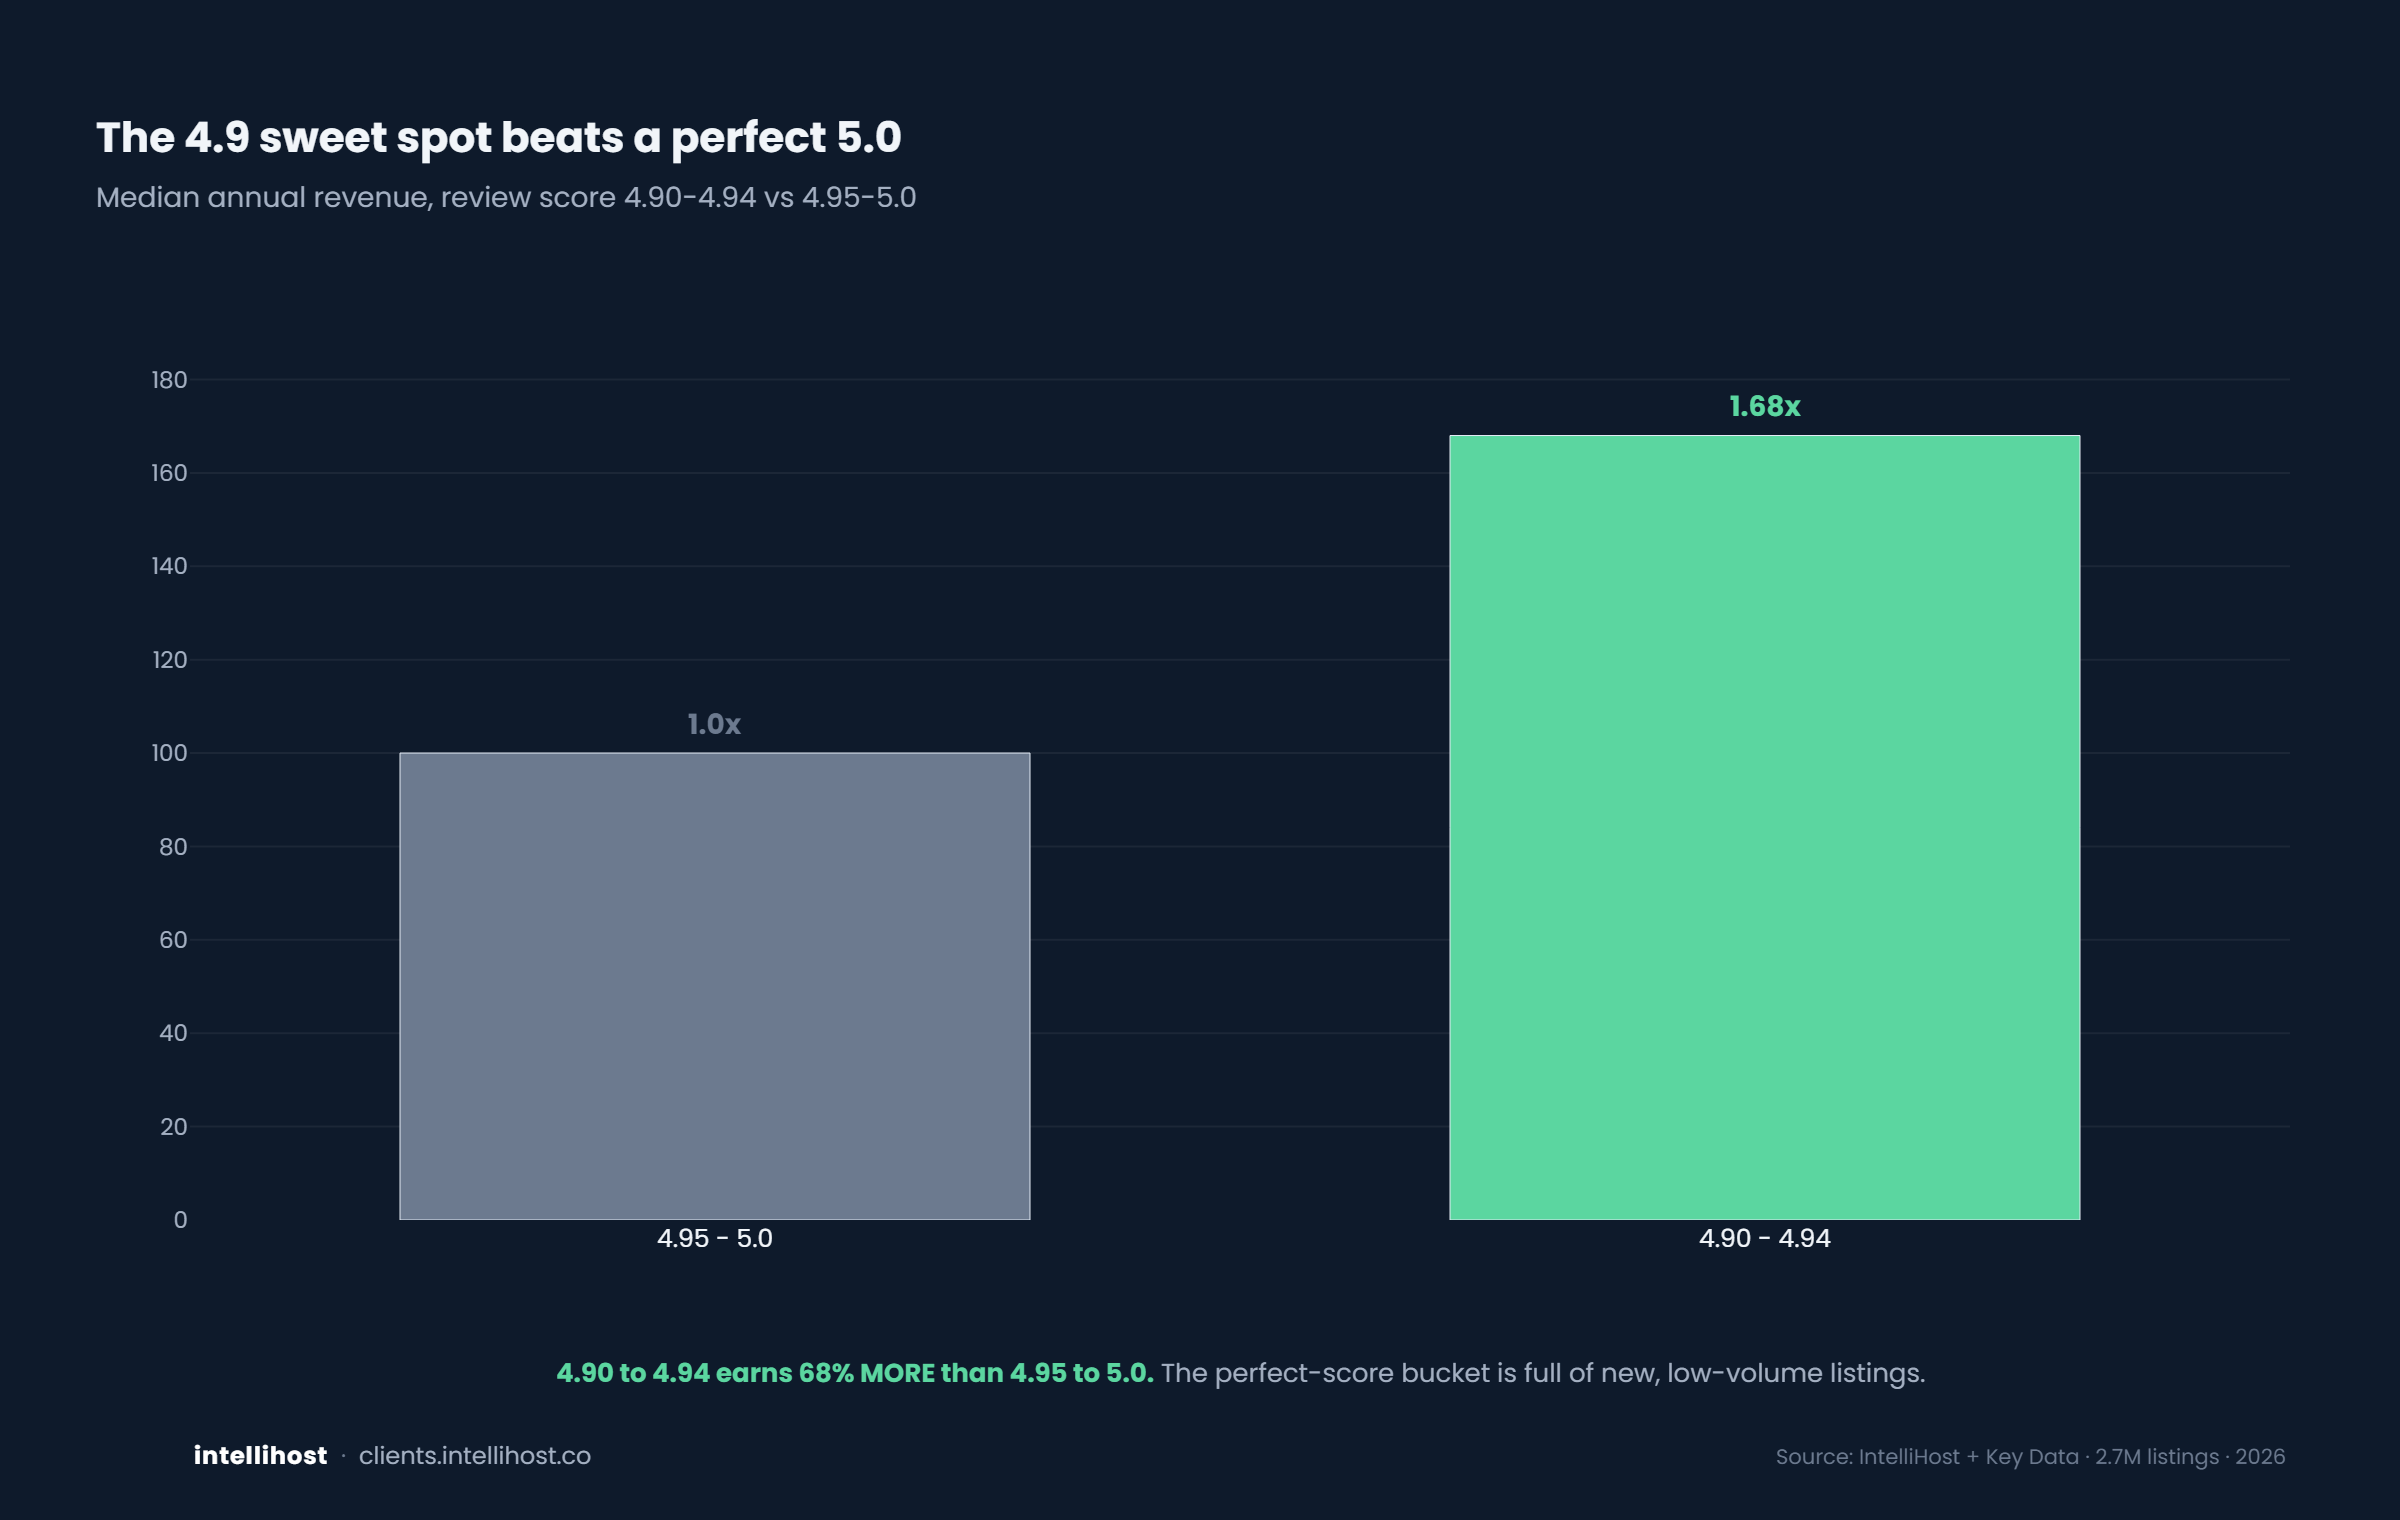
The 4.9 sweet spot beats a perfect 5.0
Chasing a 5.0 is the wrong goal.
Amenities
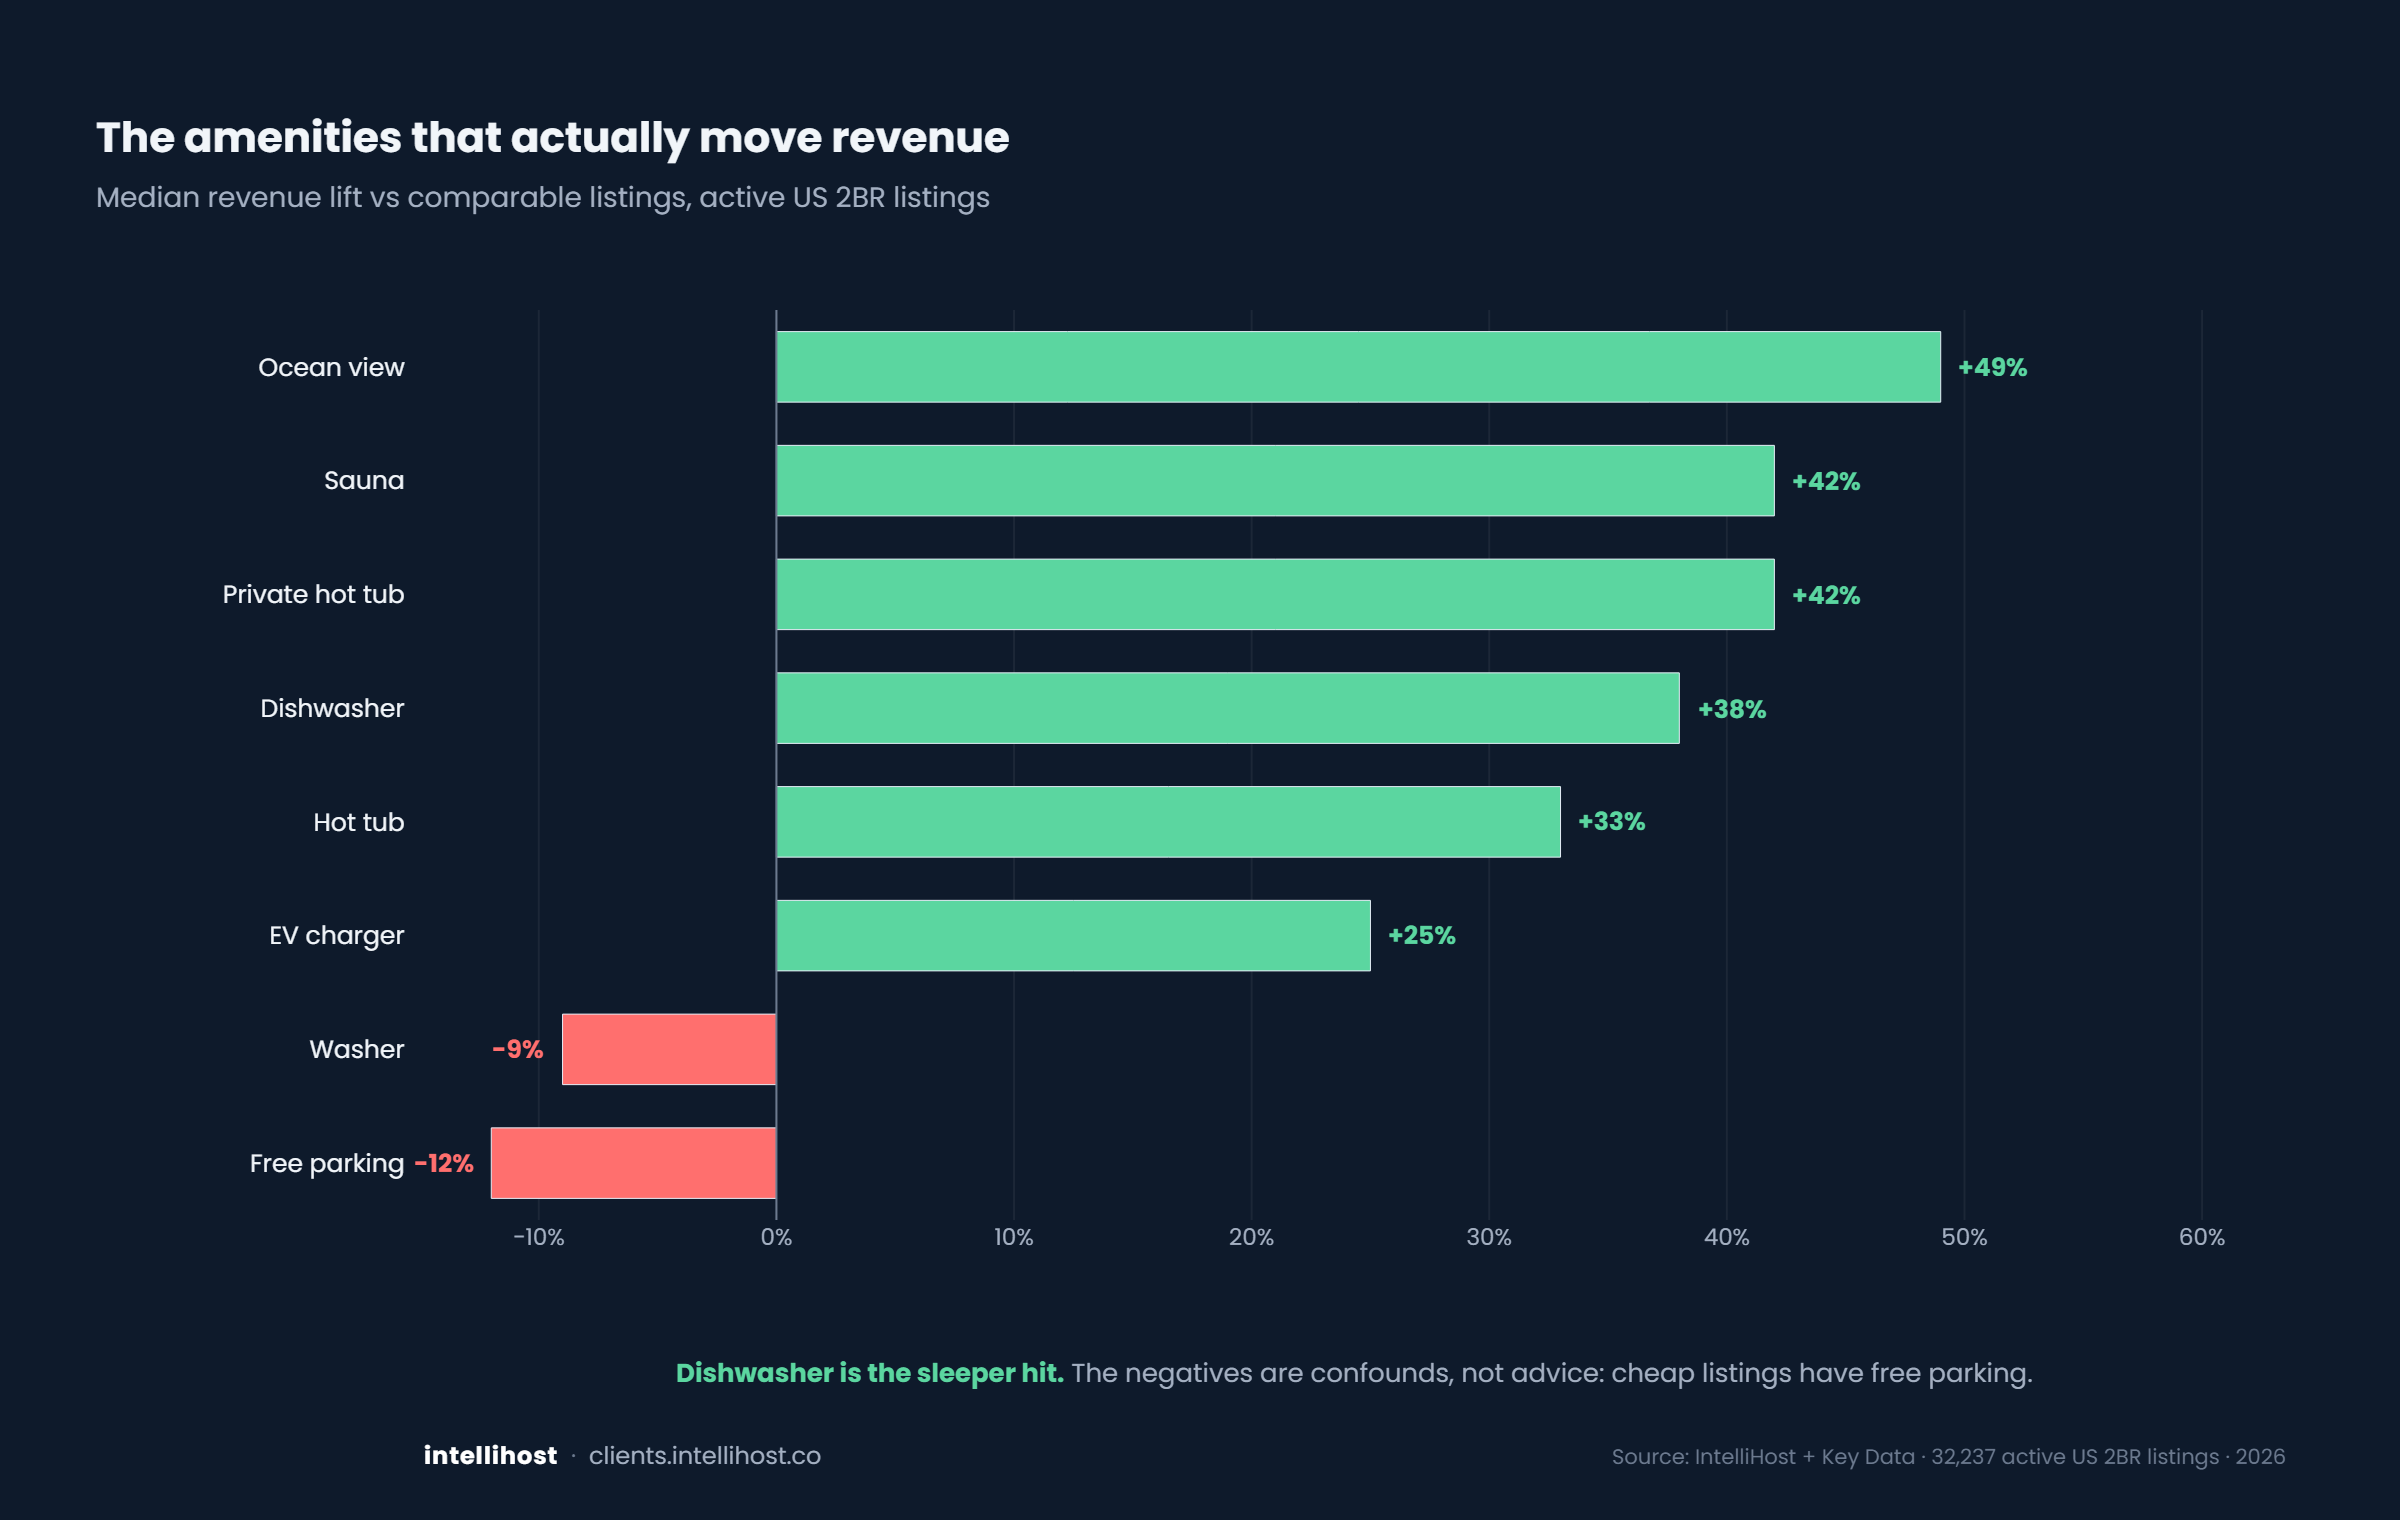
The amenities that actually move revenue
Most hosts guess at amenities. We ranked them.
Property
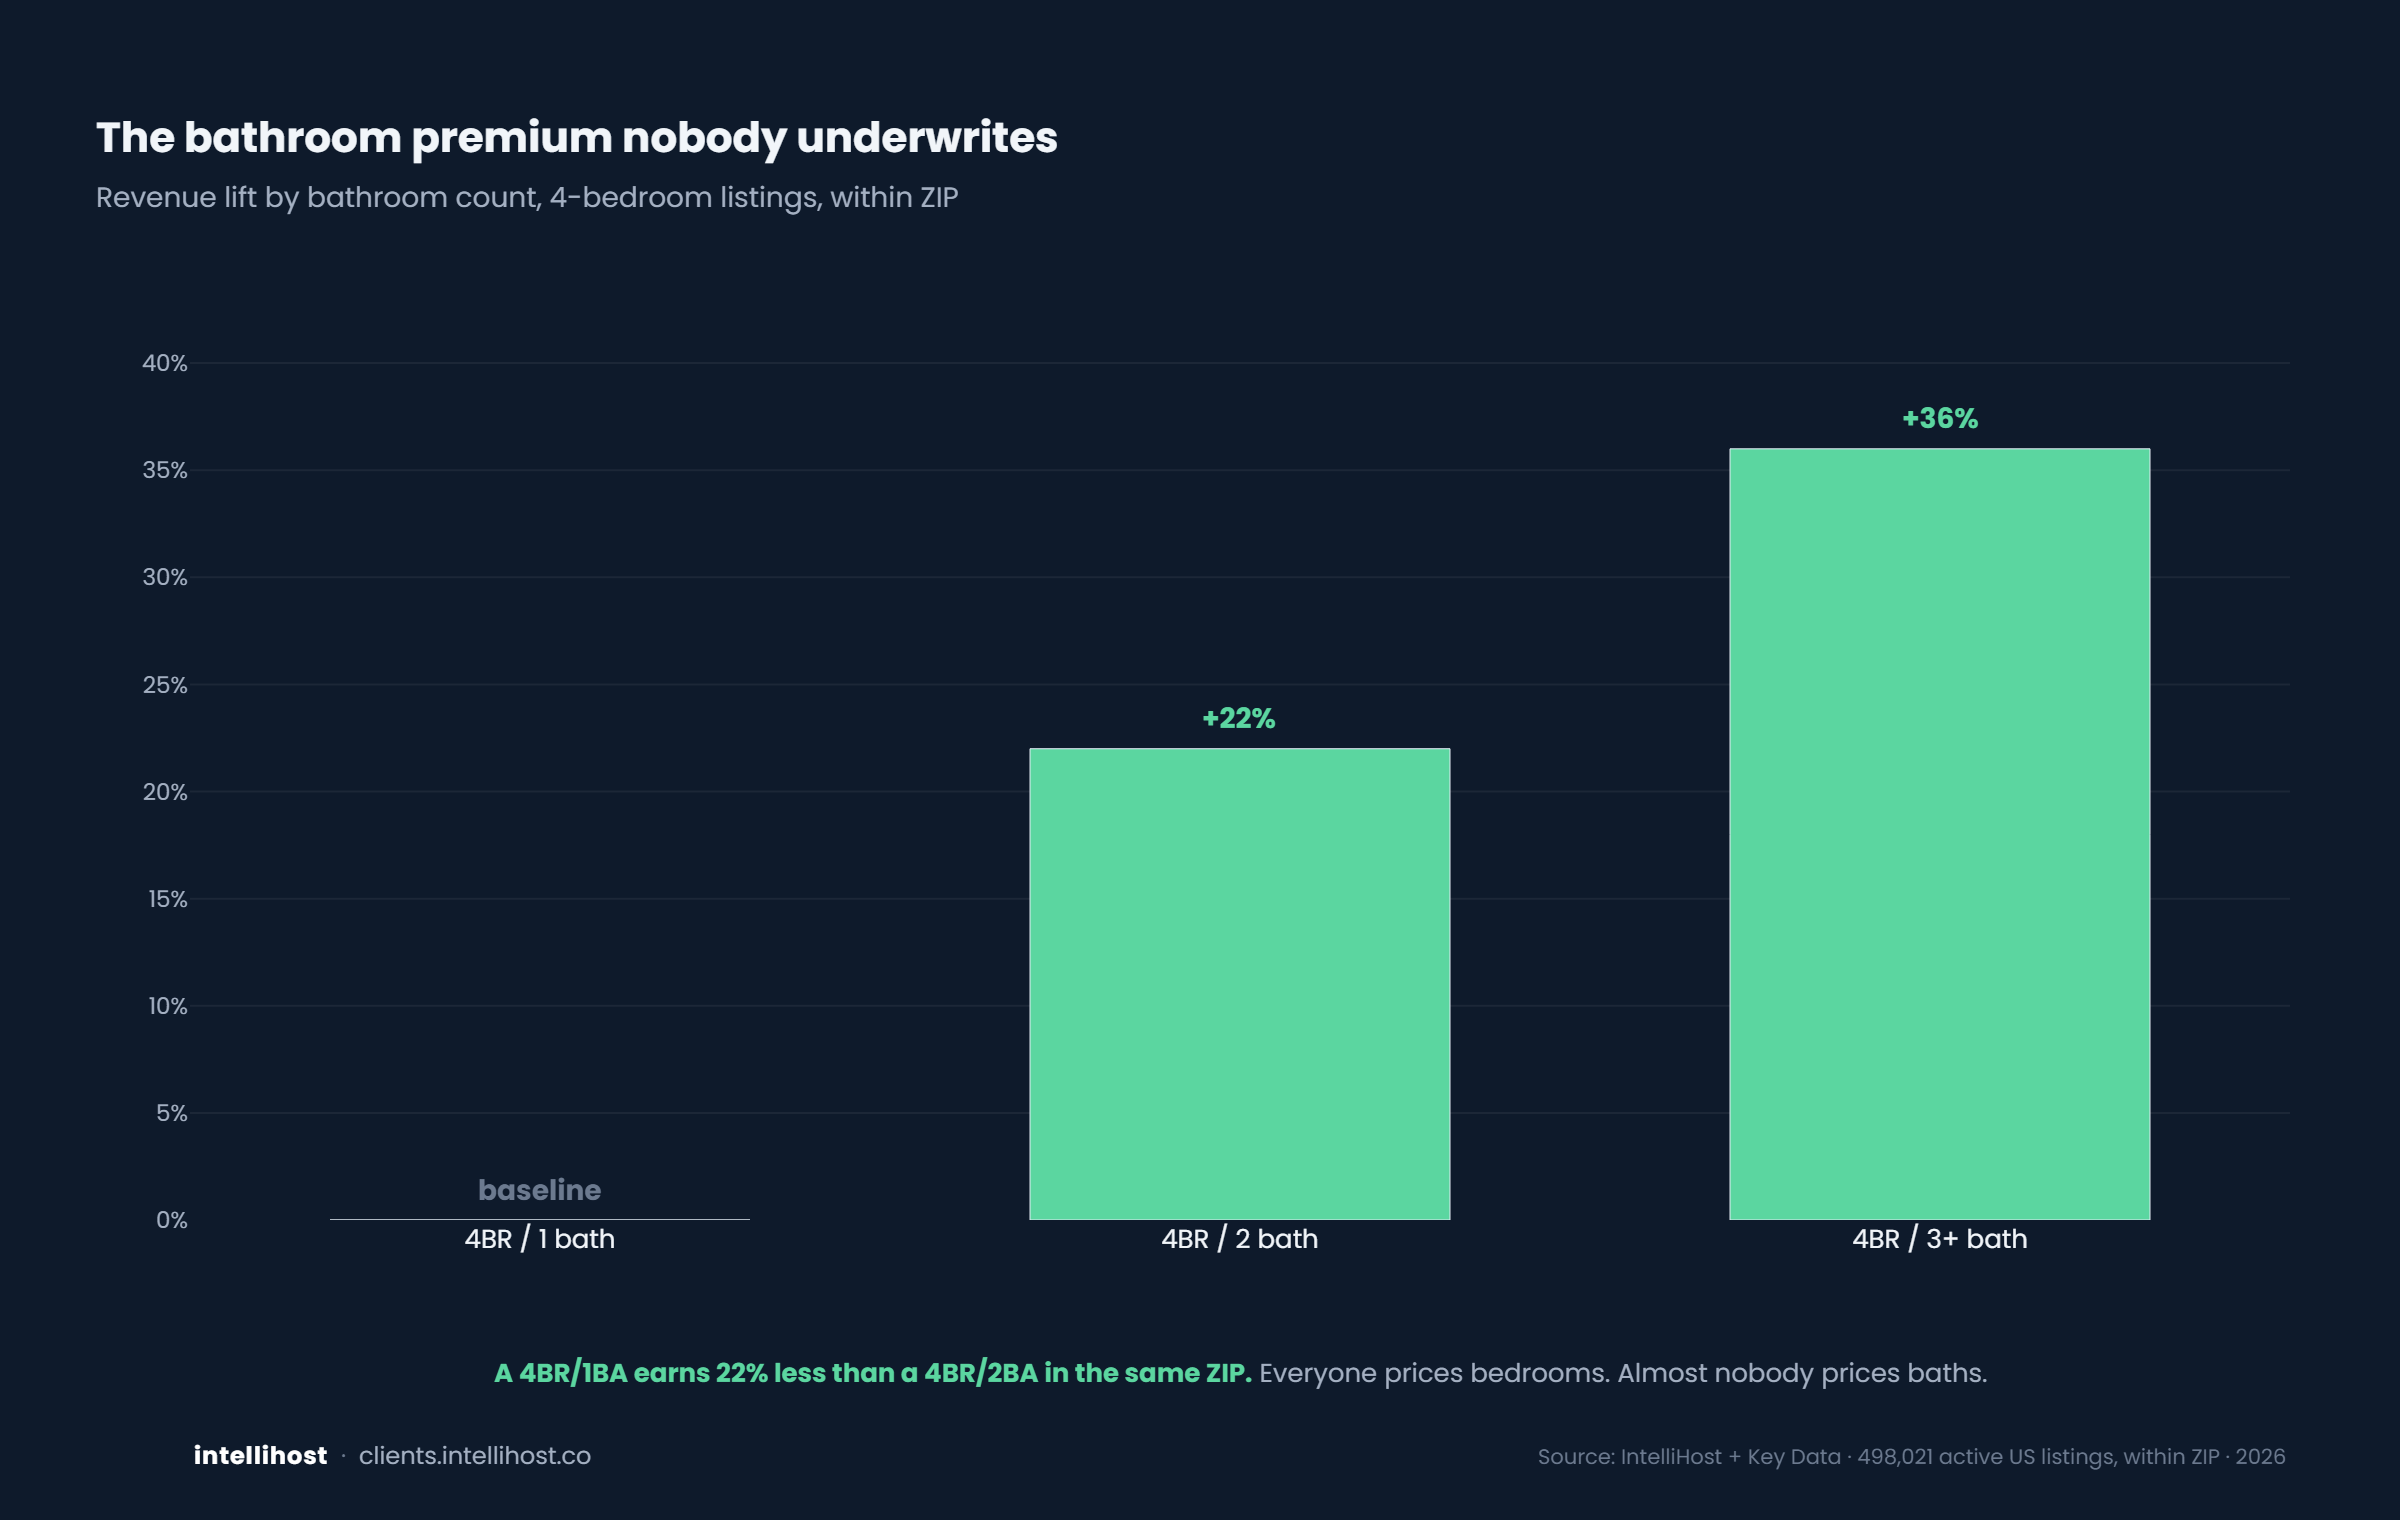
The bathroom premium nobody underwrites
Everyone prices bedrooms. Almost nobody prices baths.
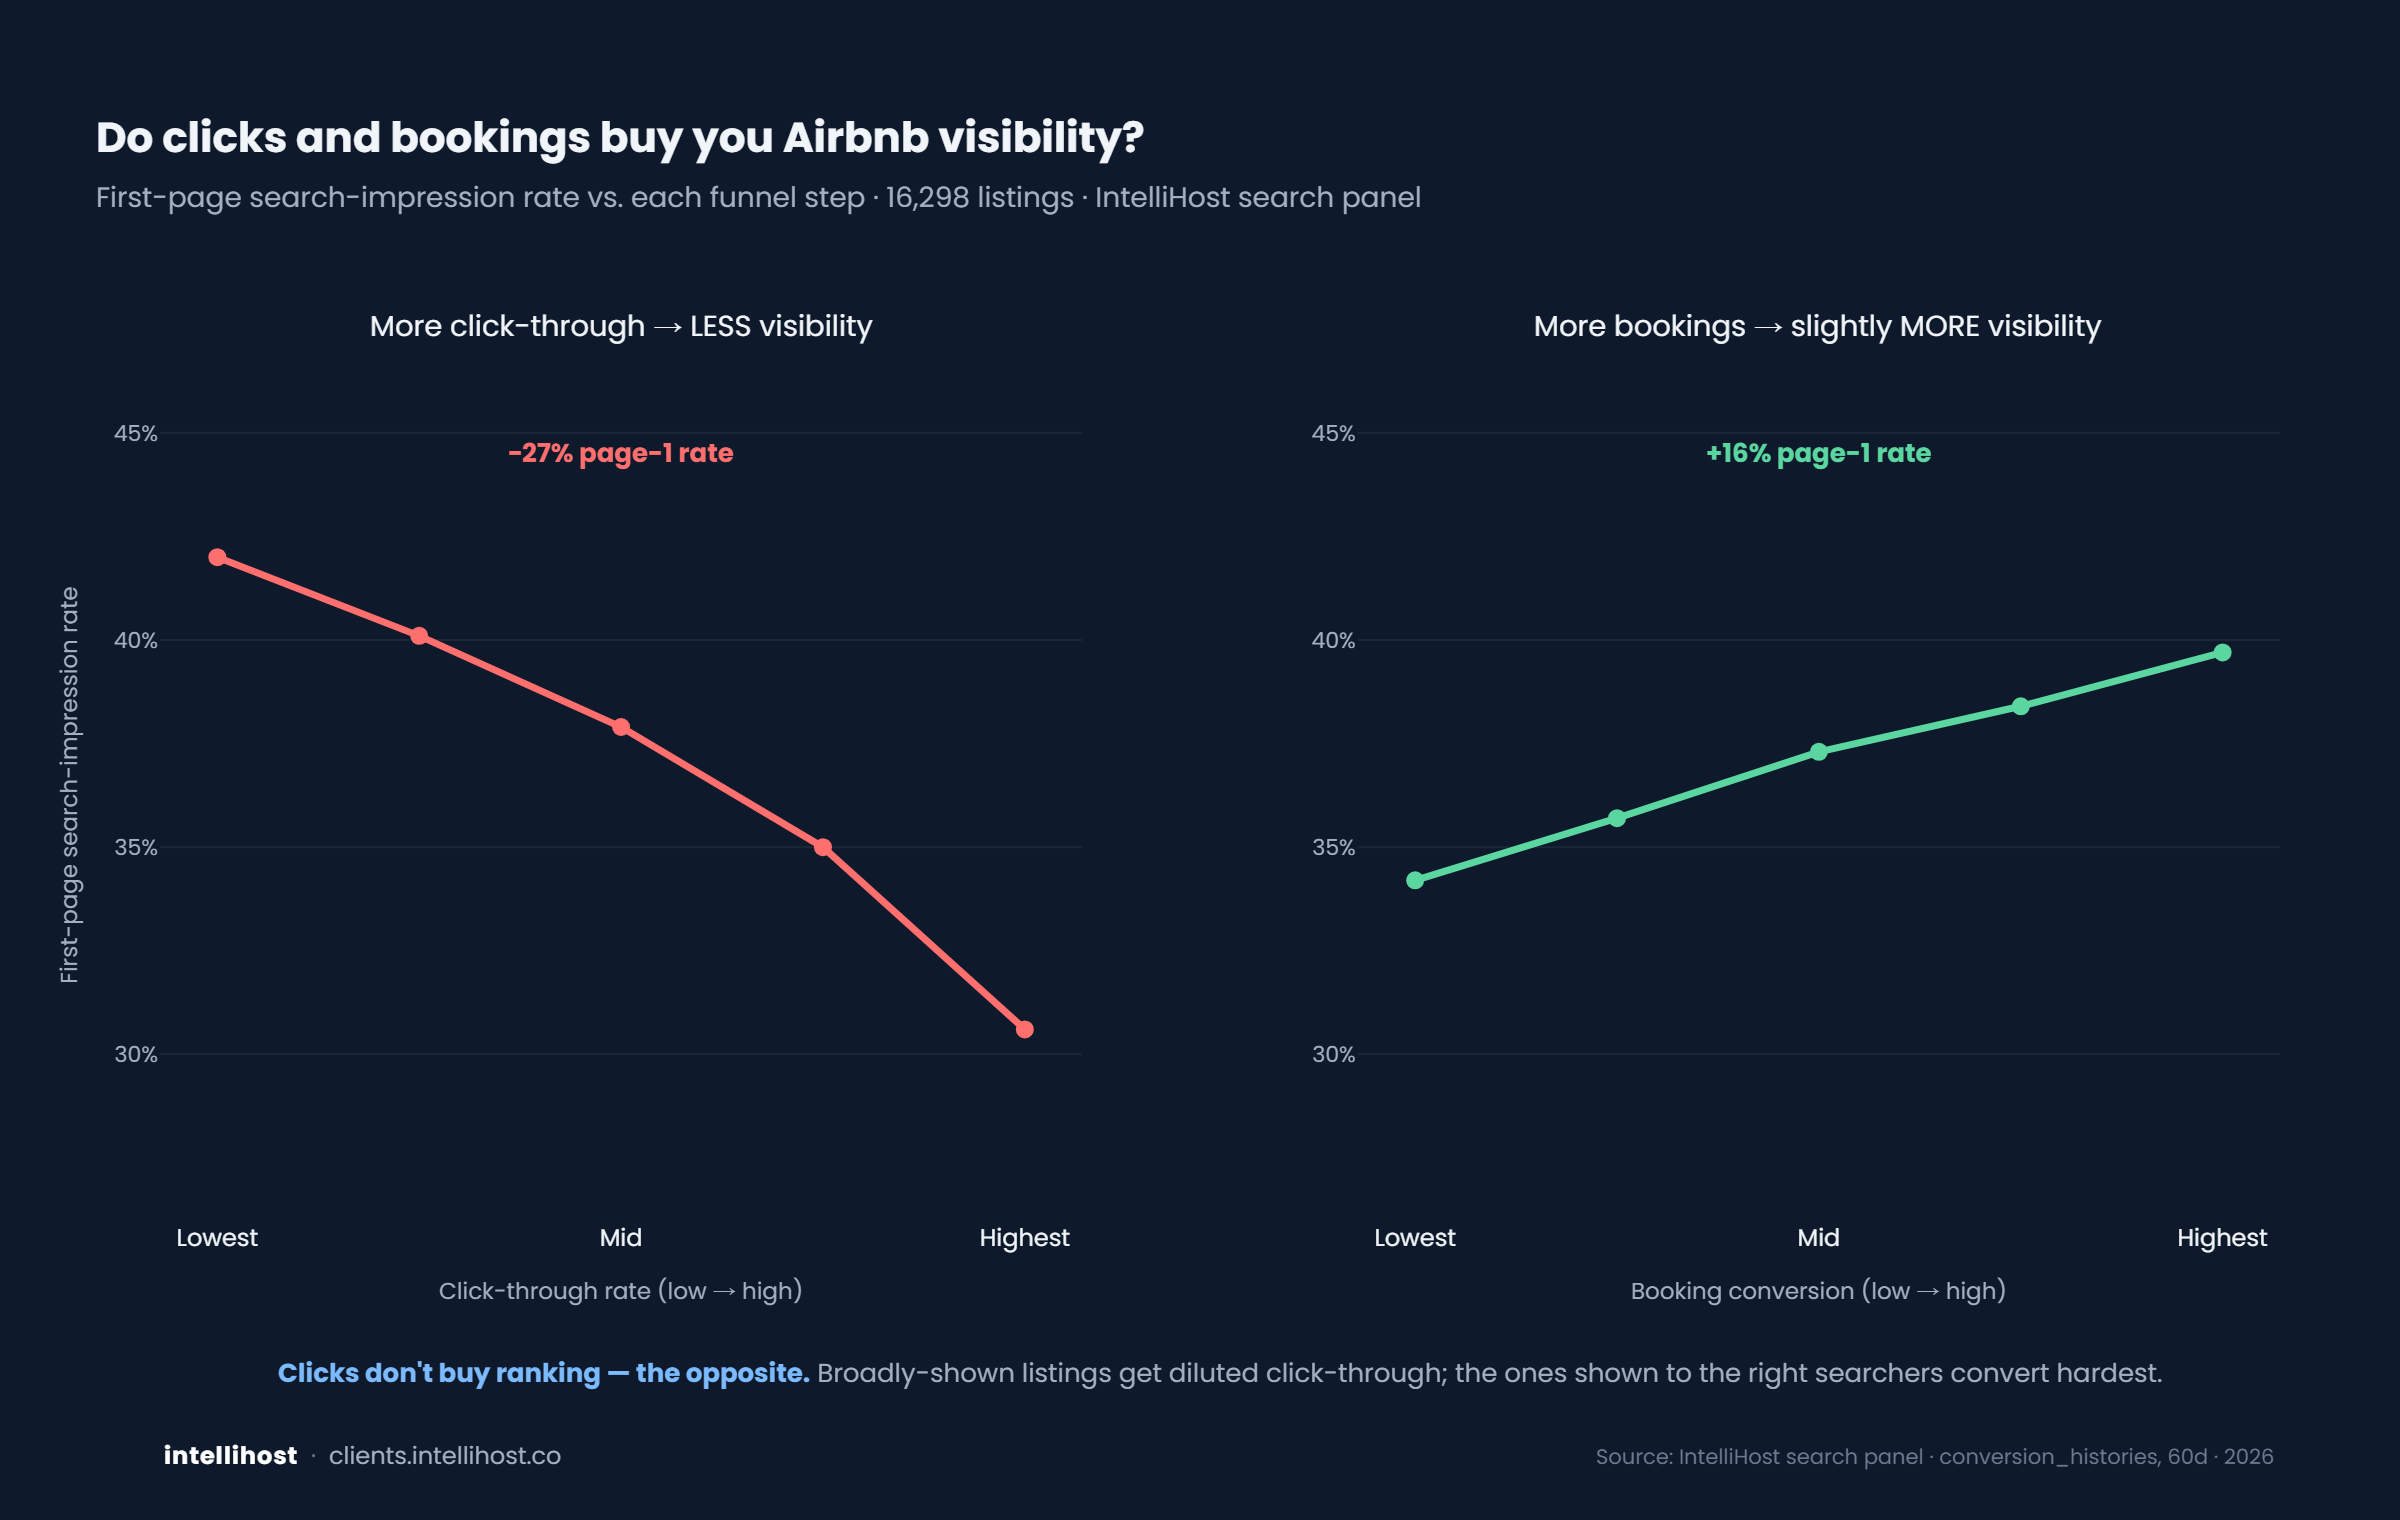
Listing craft
The click-rate paradox
A result that stopped us.
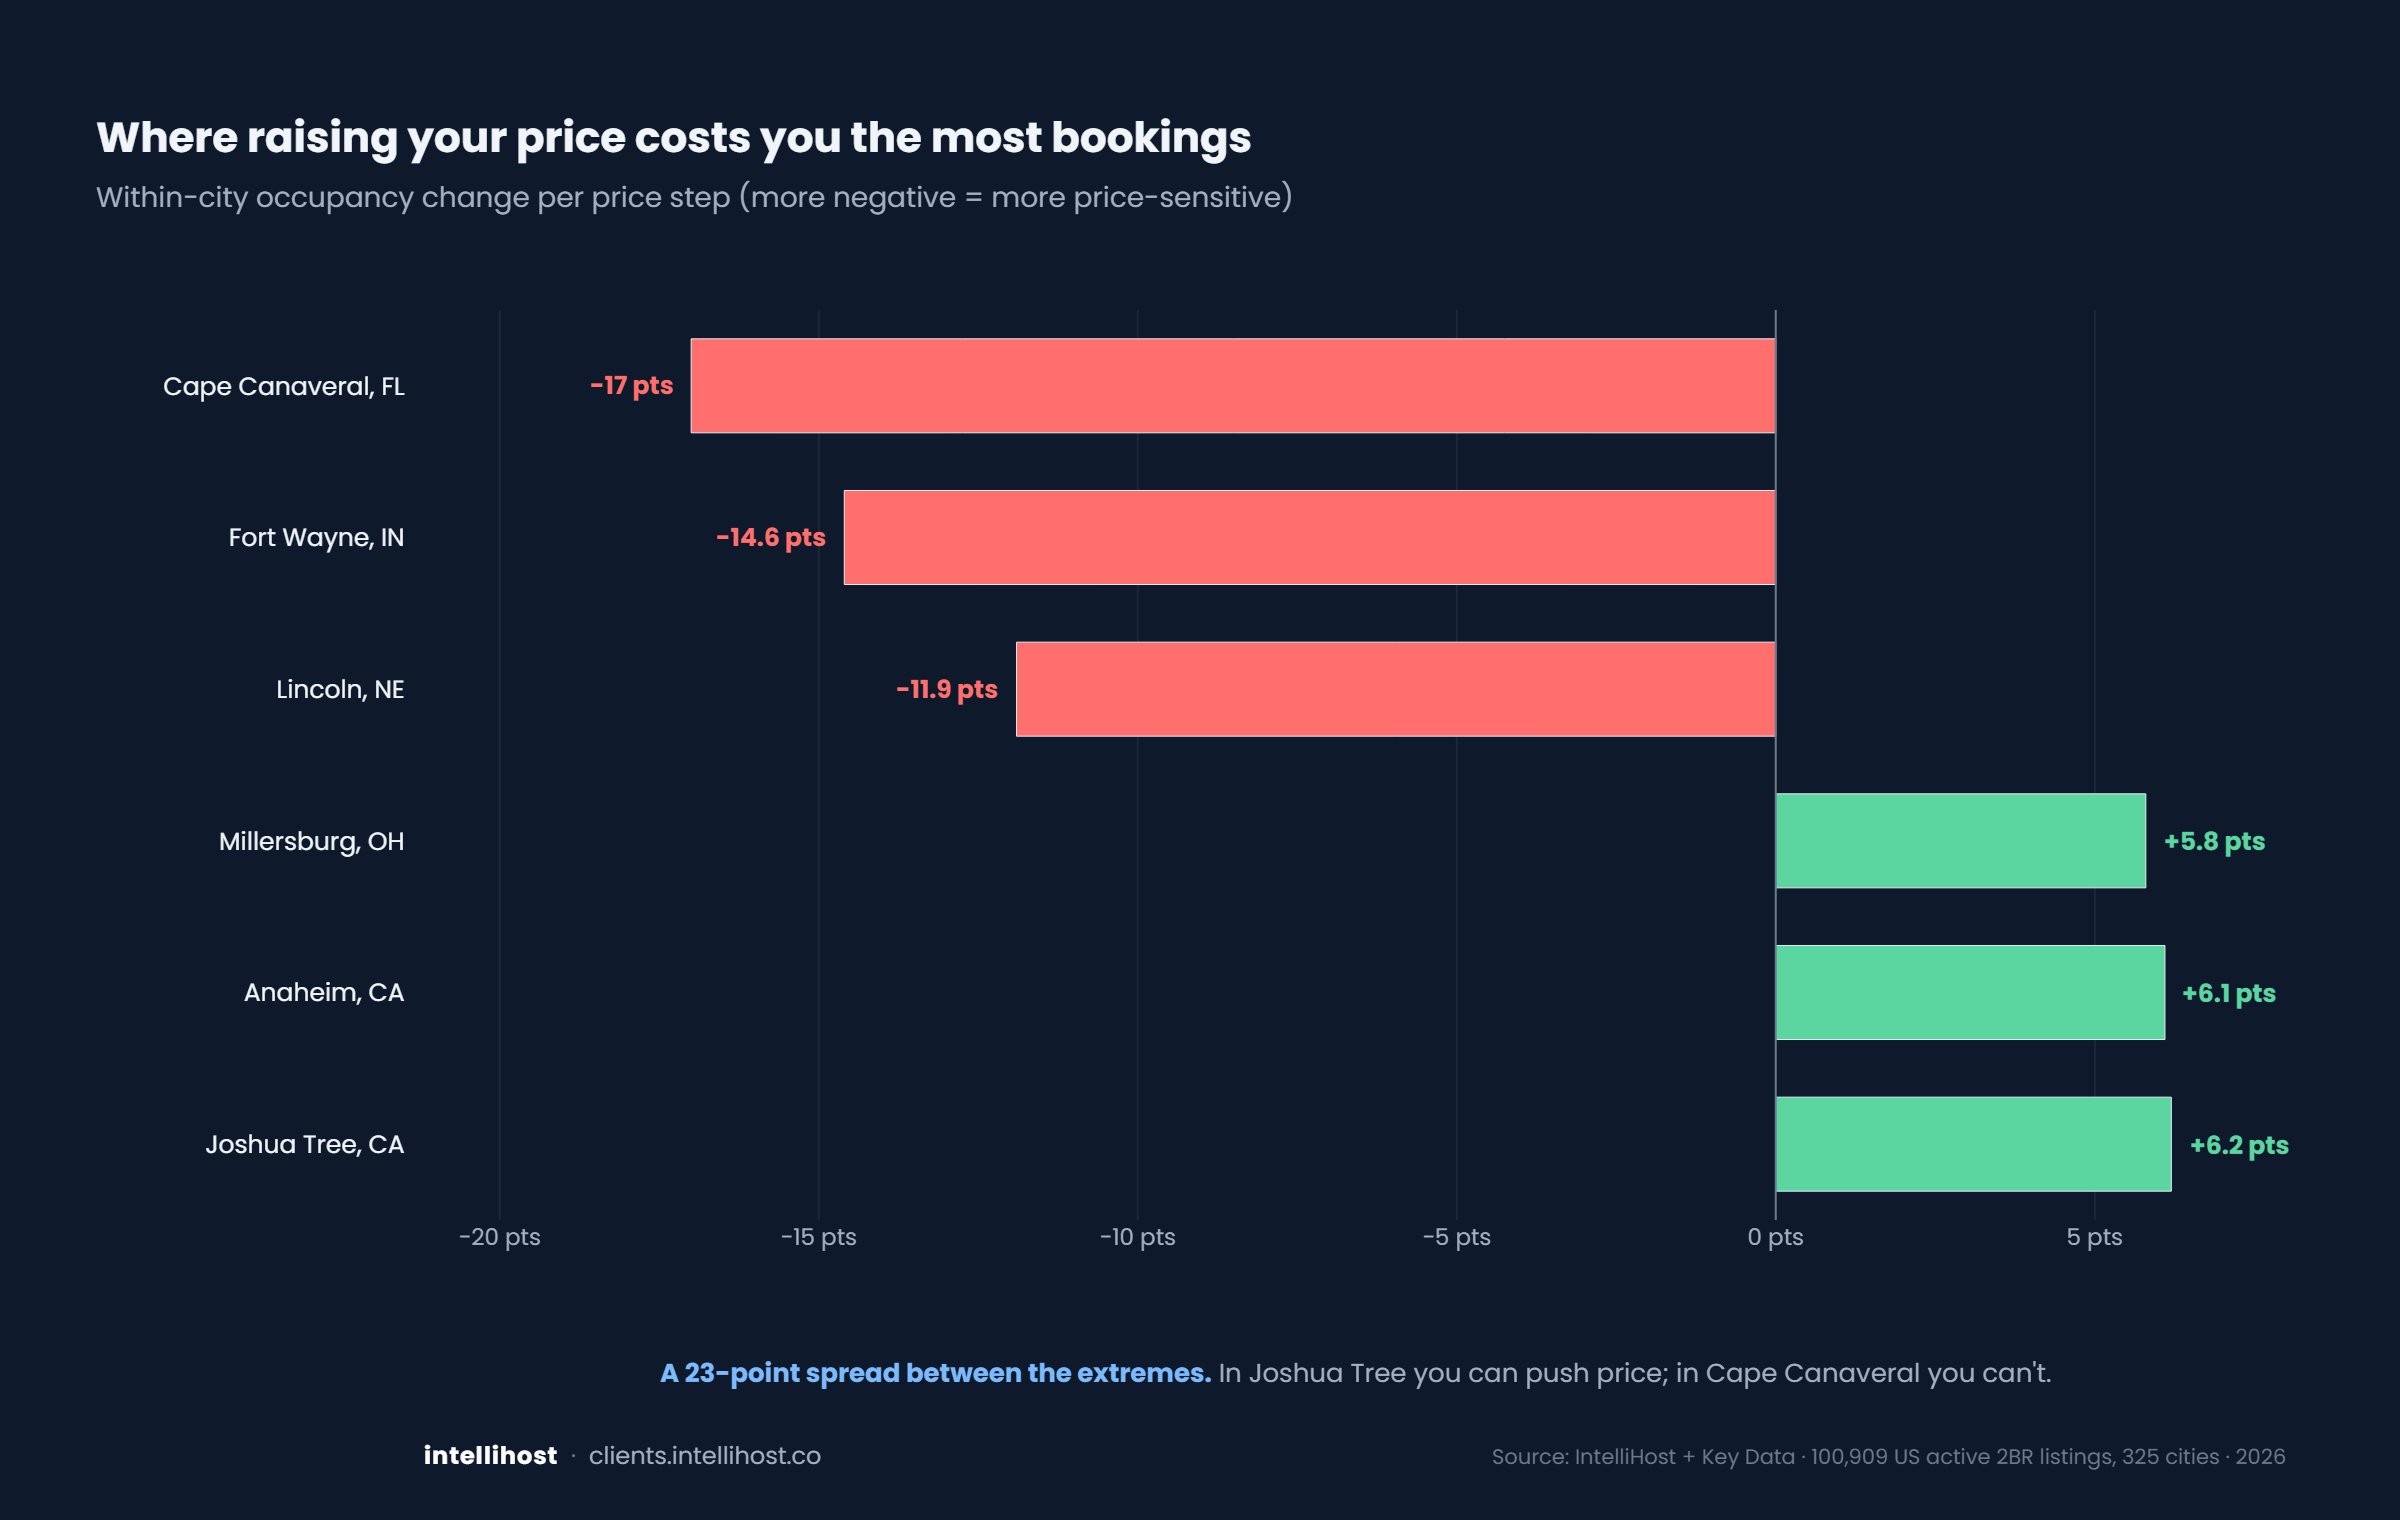
Market
The most and least price-sensitive cities
Where you can push rate, and where you can't.
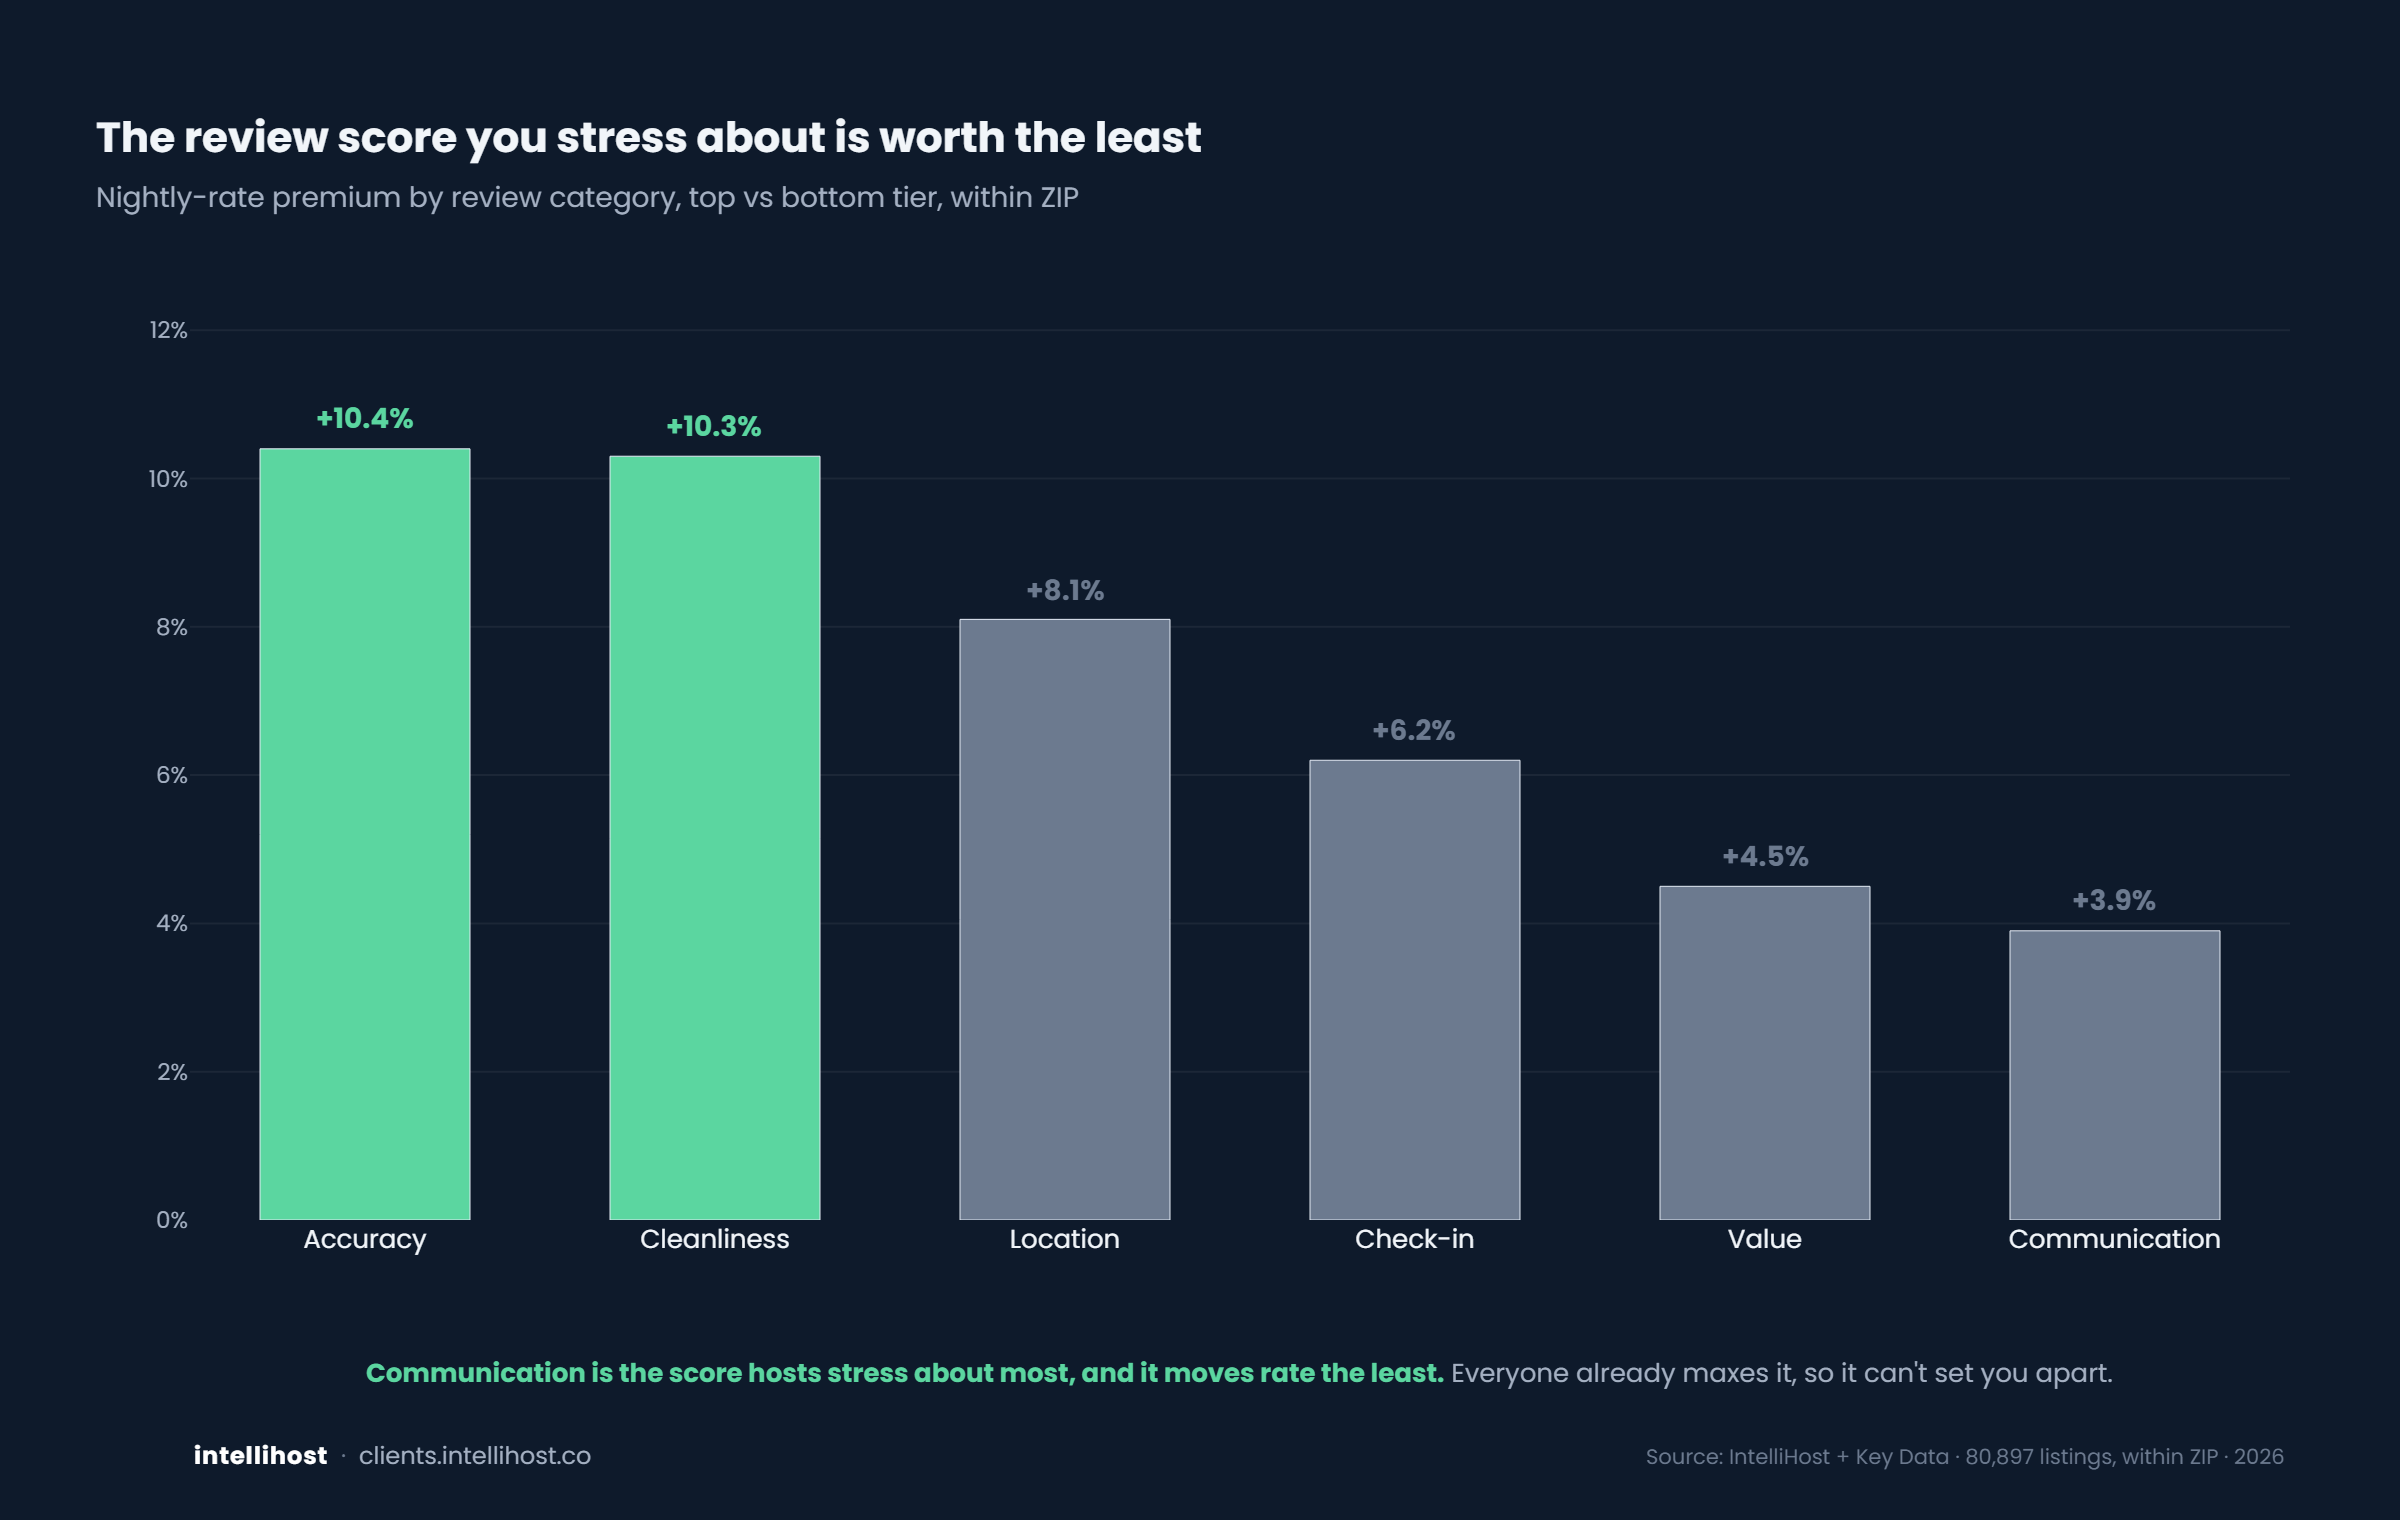
Reviews
The review score you stress about is worth the least
Communication is table stakes.
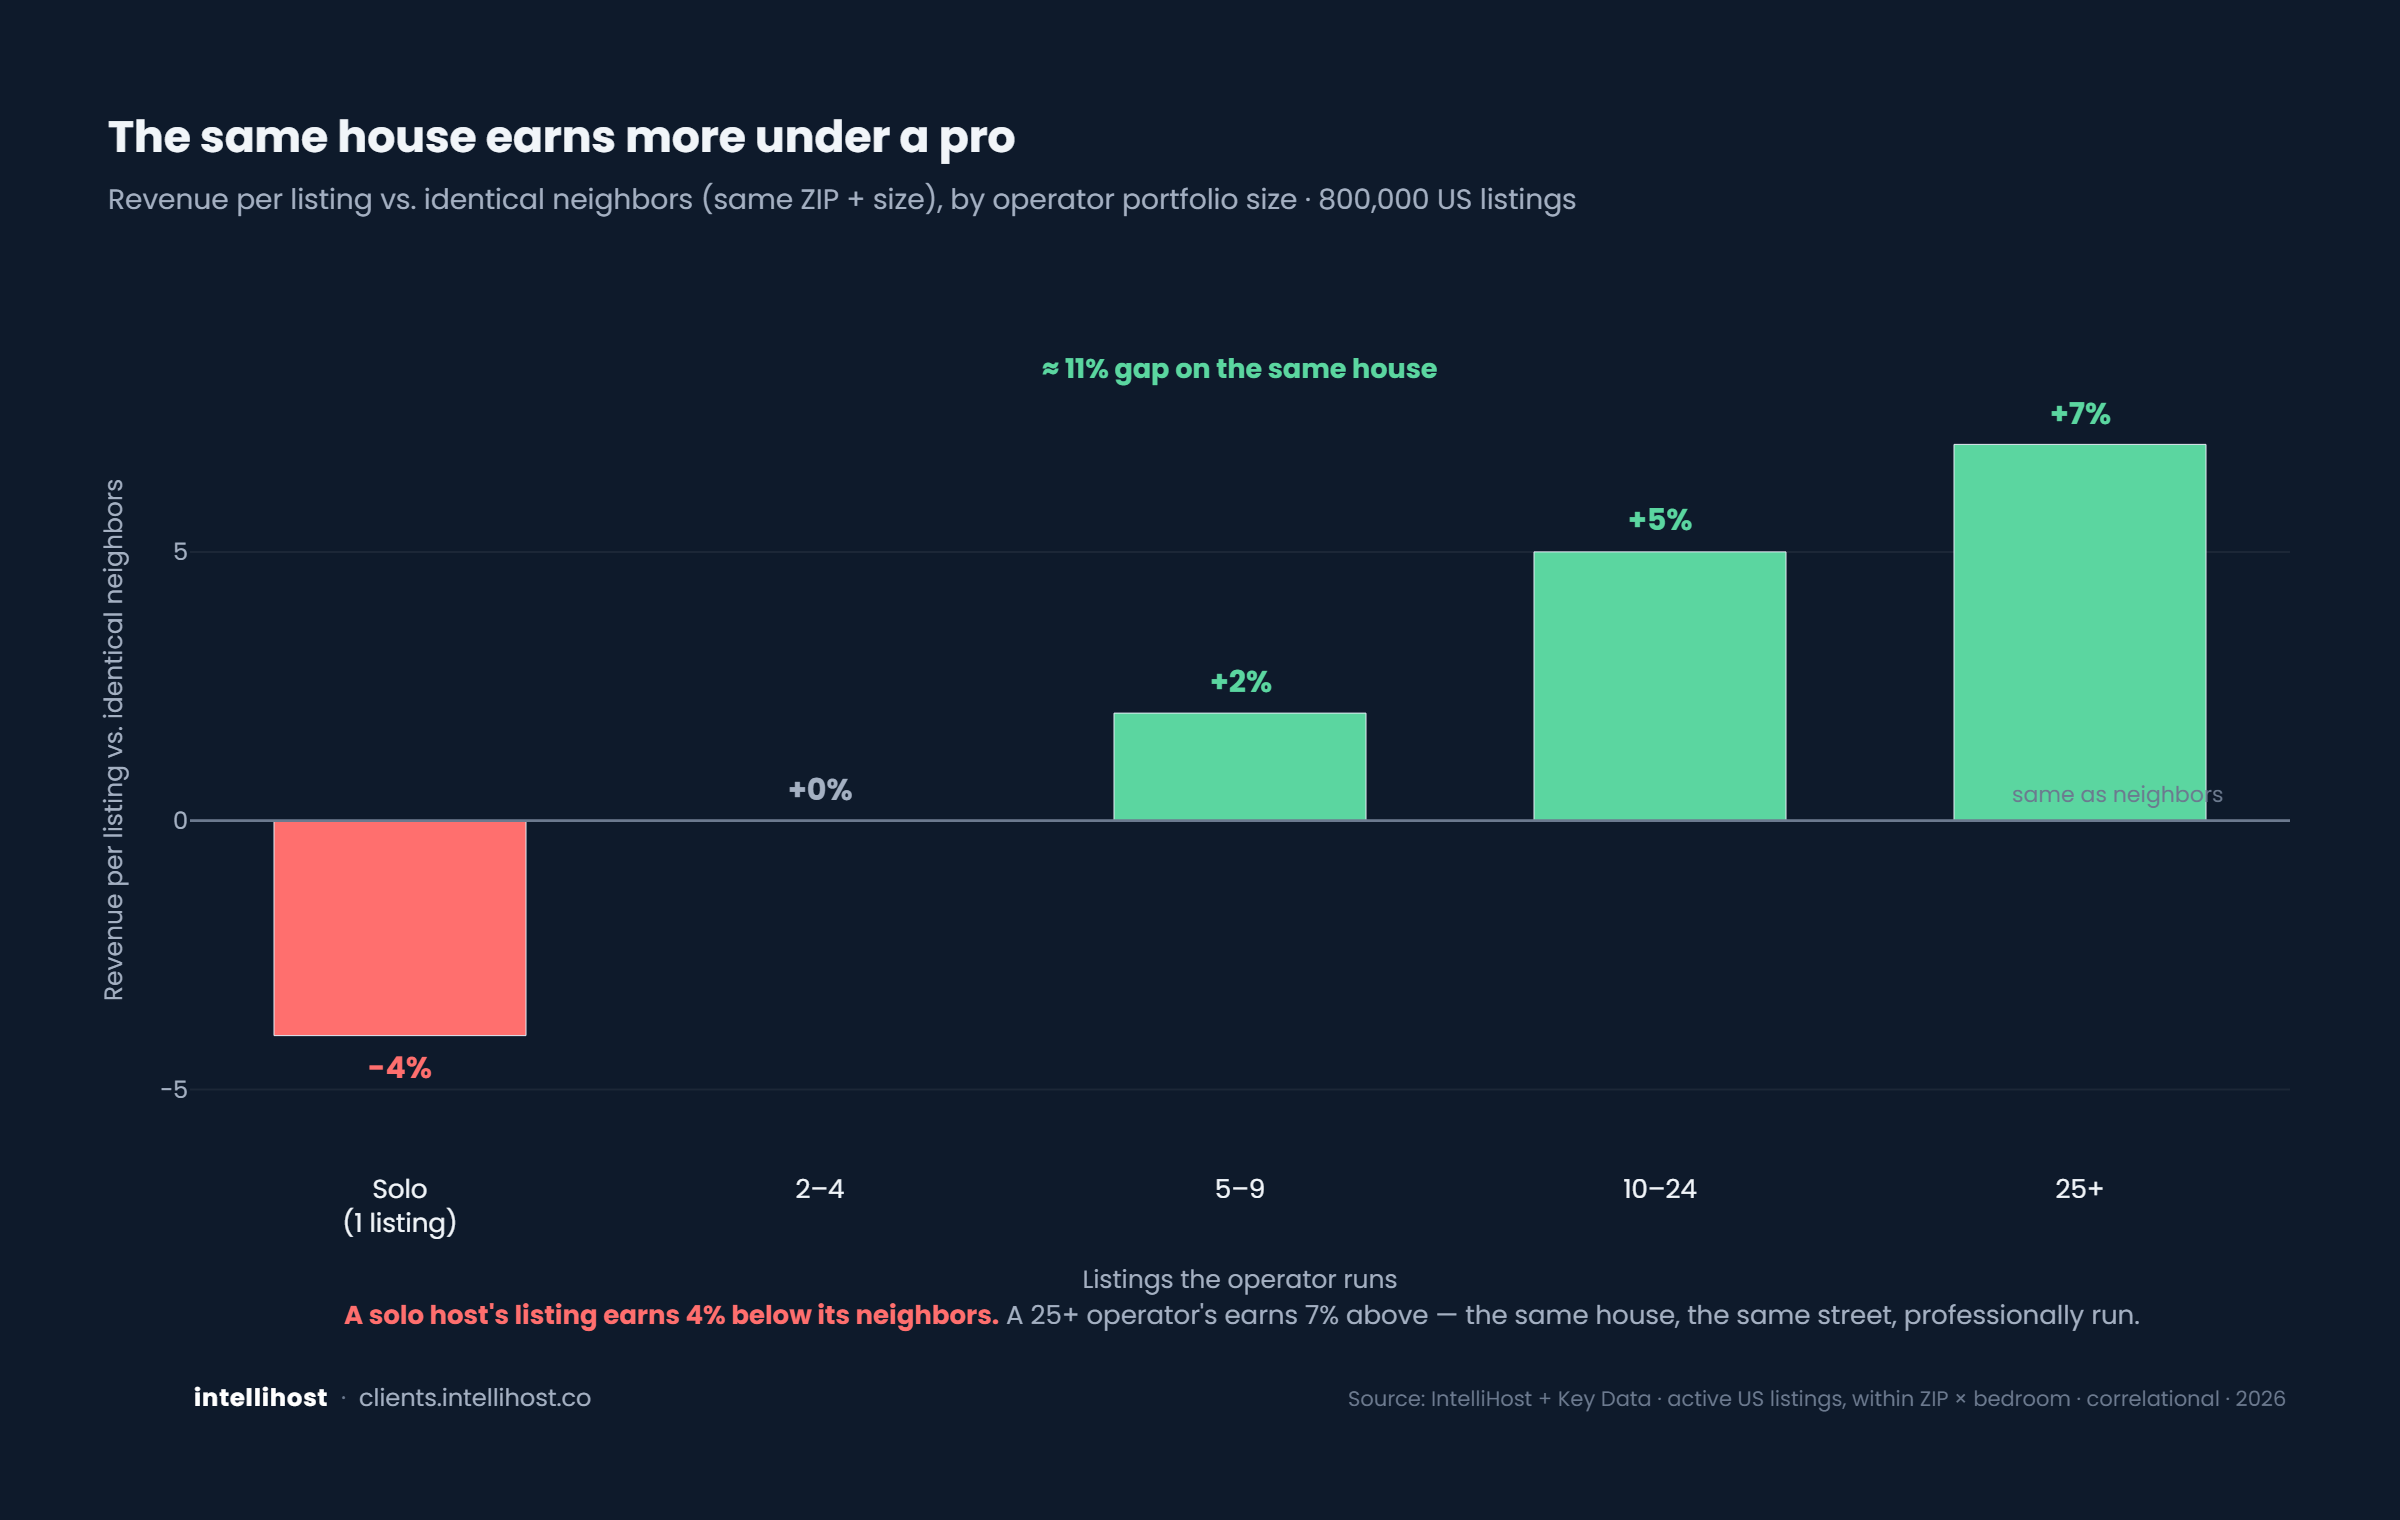
Operations
The same house earns more under a pro
Tell your owner this before they self-manage.
Operations
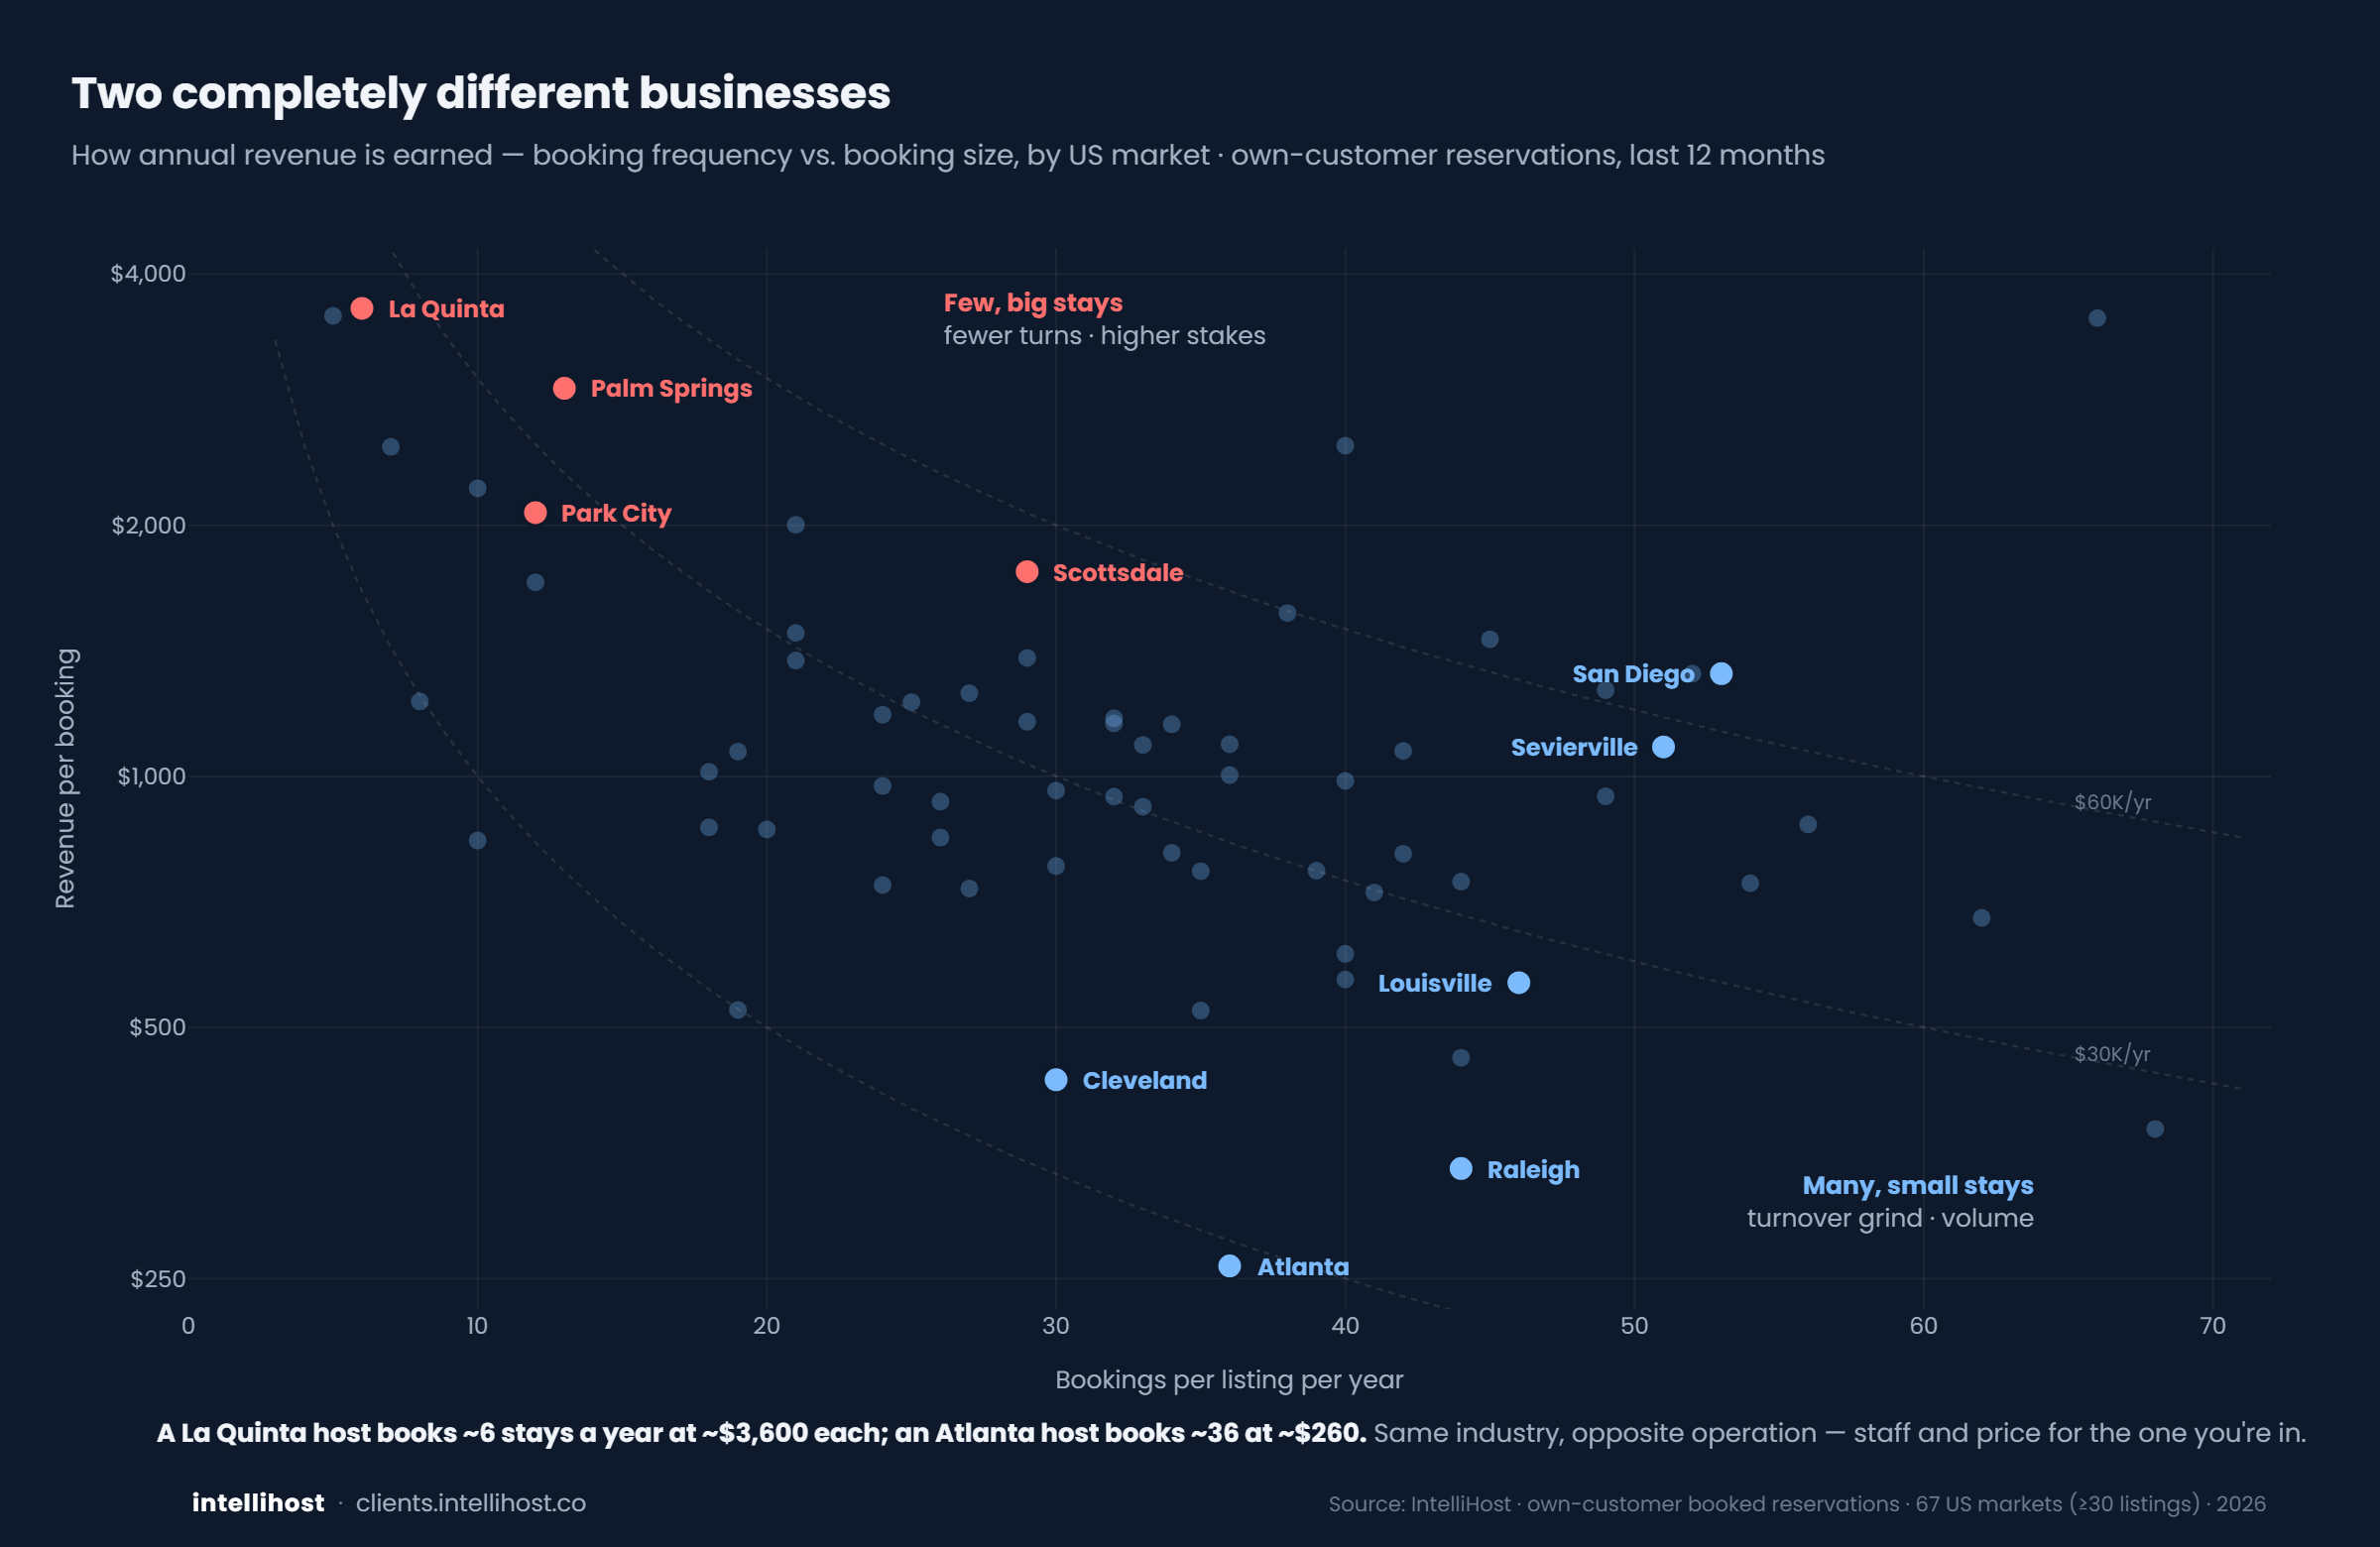
Two completely different businesses
Same revenue, opposite operation.
Market
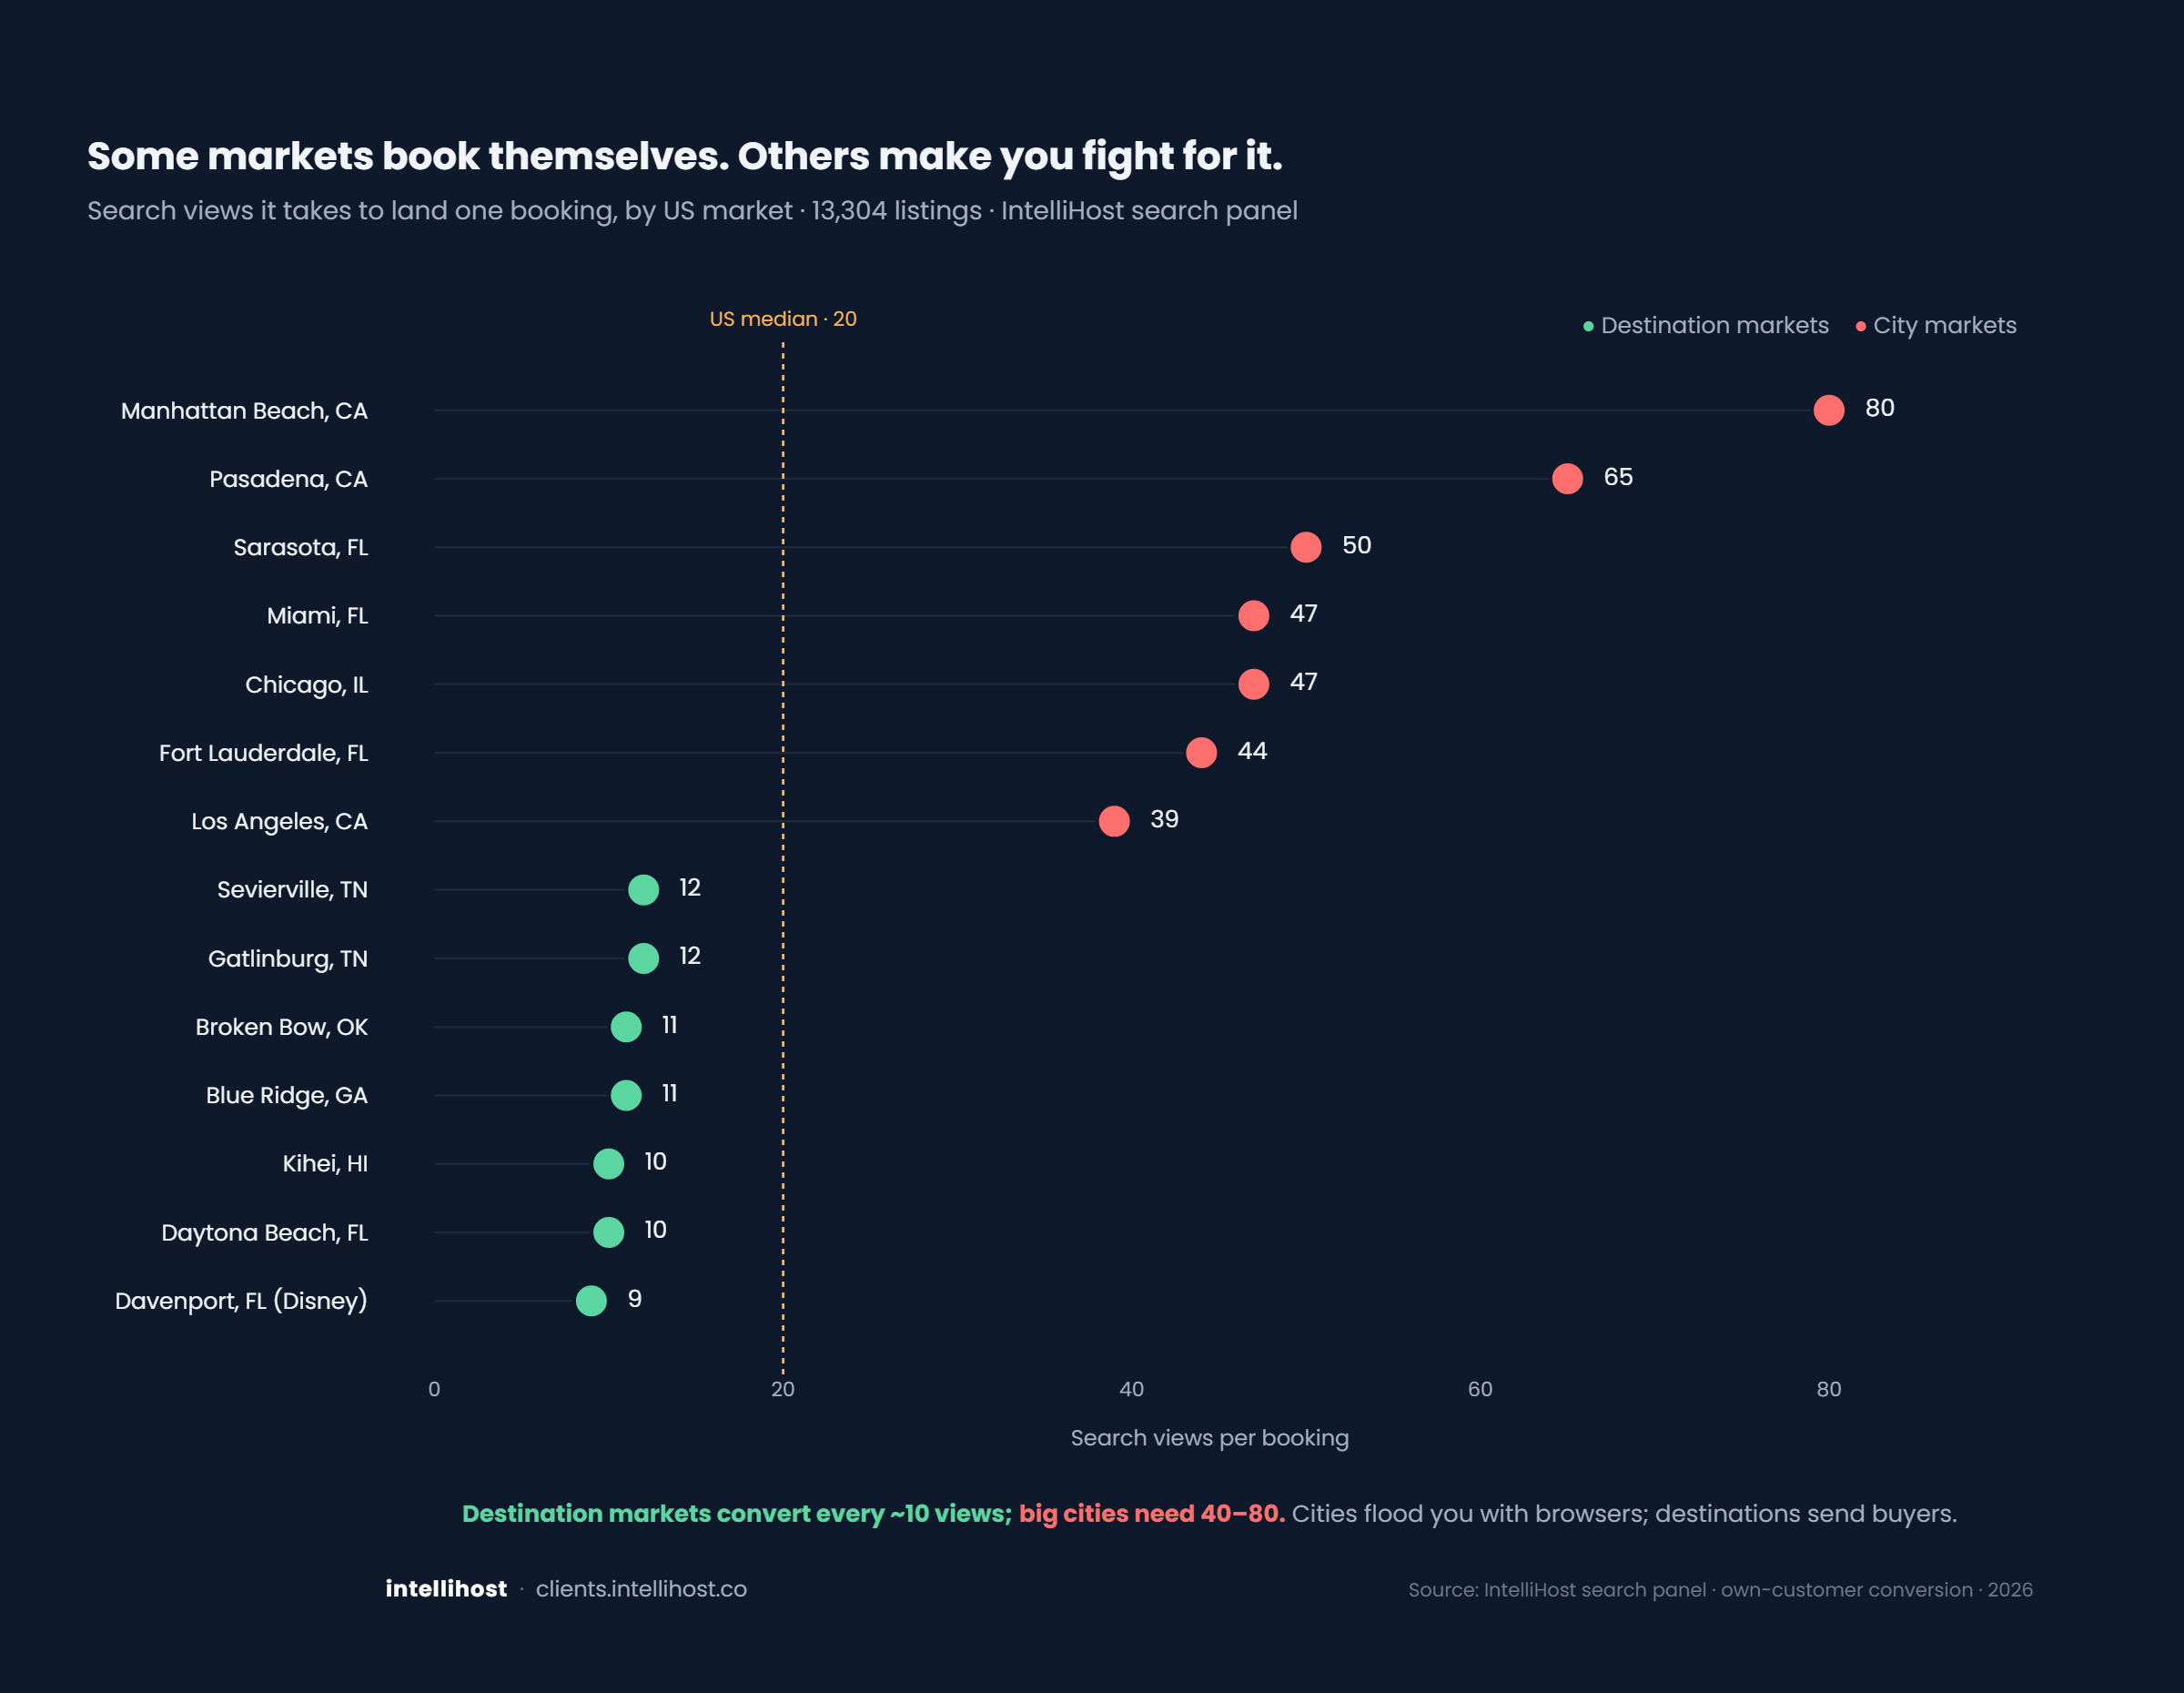
Two hosts, two completely different jobs
How hard your market makes you work for a booking.
Operations
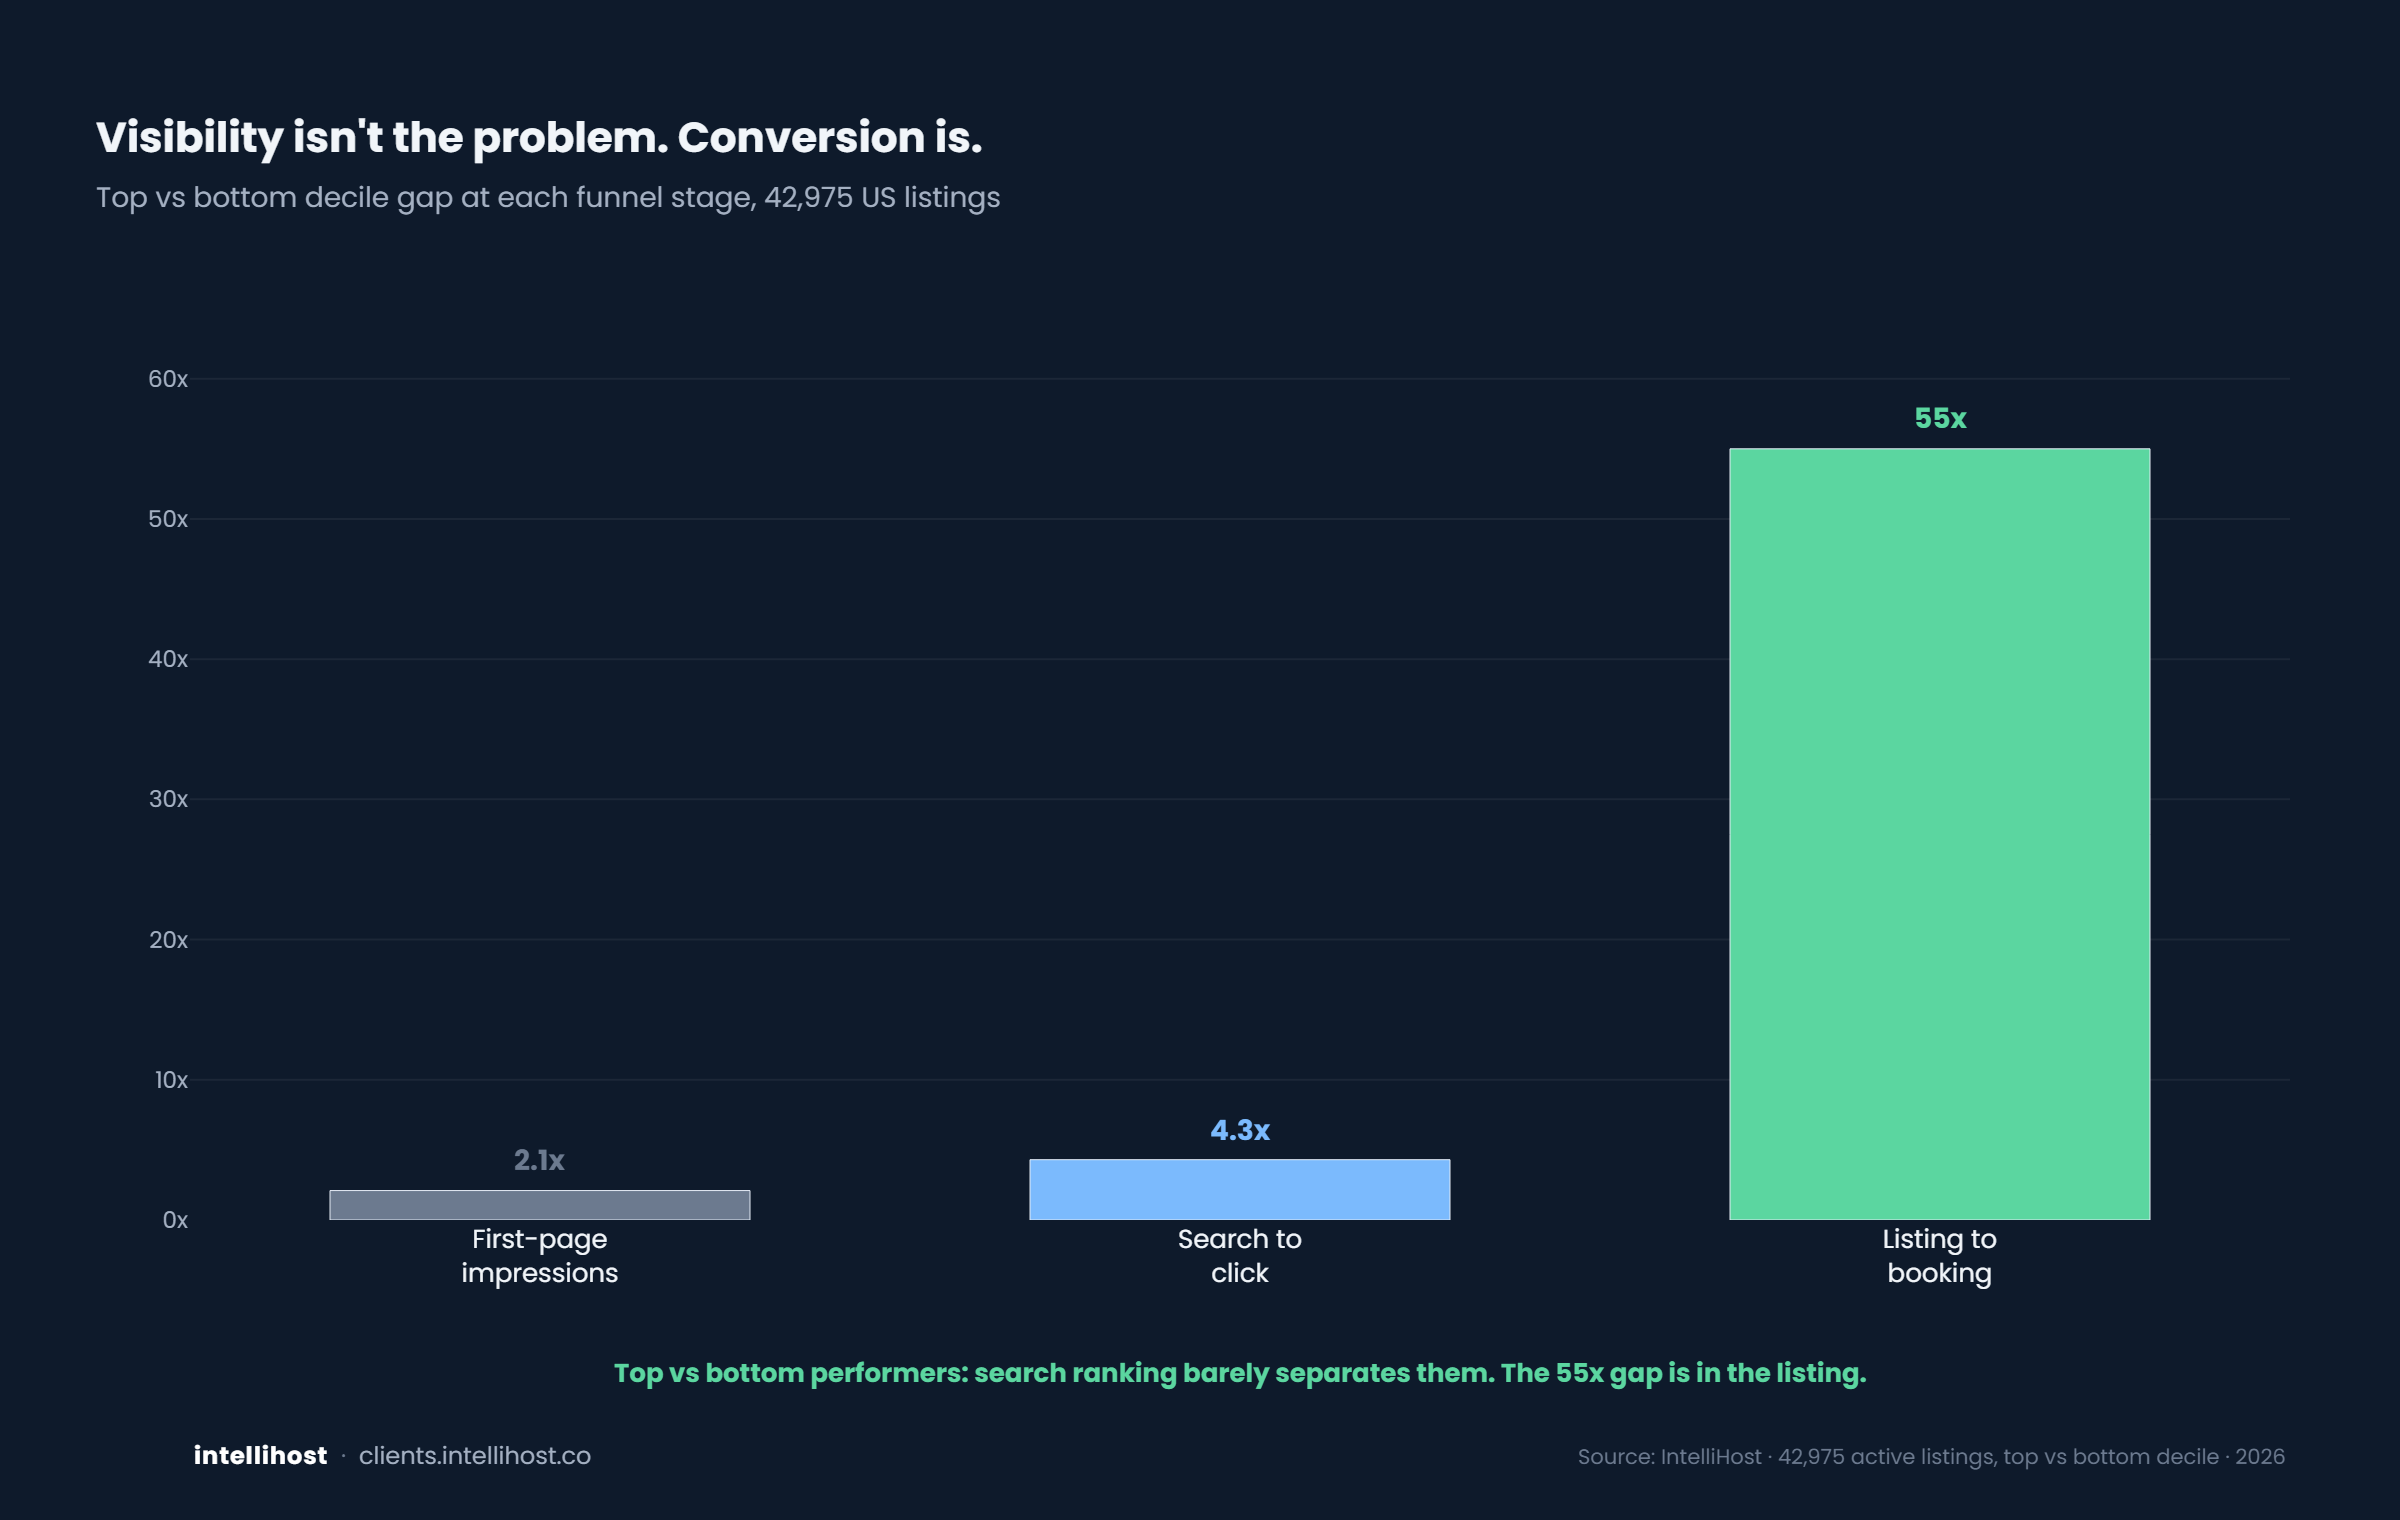
Visibility isn't the problem. Conversion is.
The 55x gap is in the listing.
Reviews
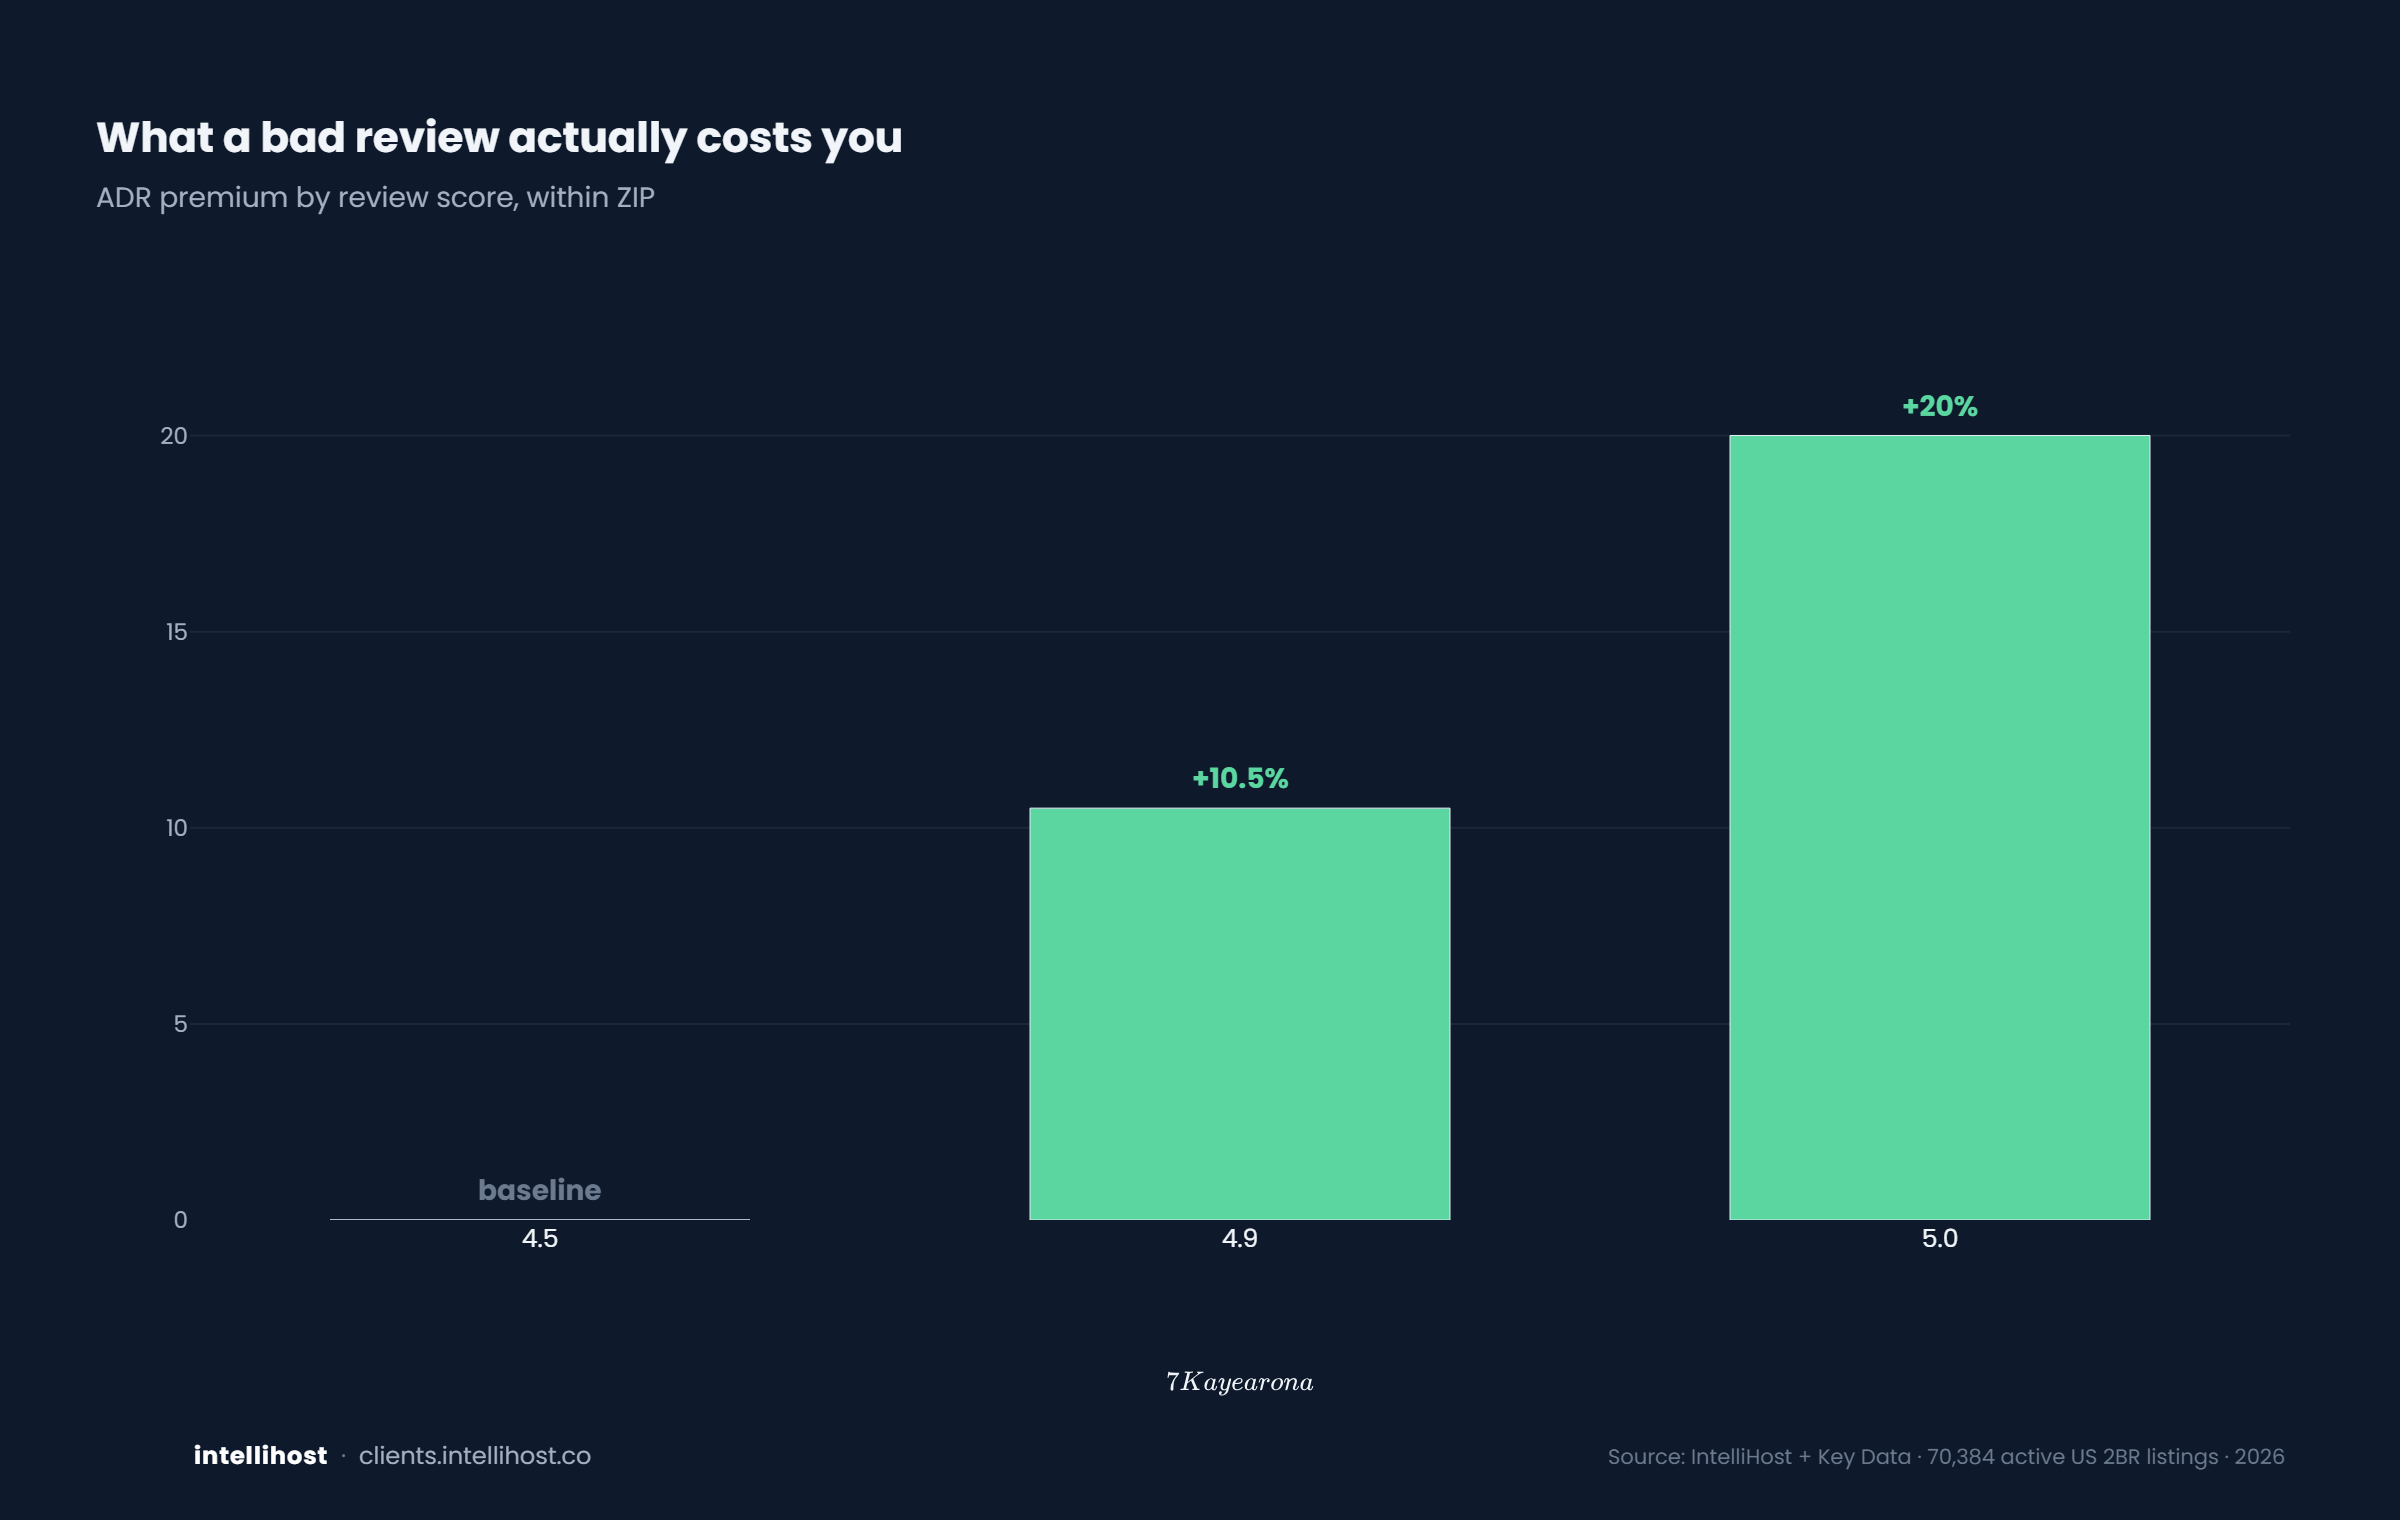
What a bad review actually costs you
In cold, hard dollars.
Amenities
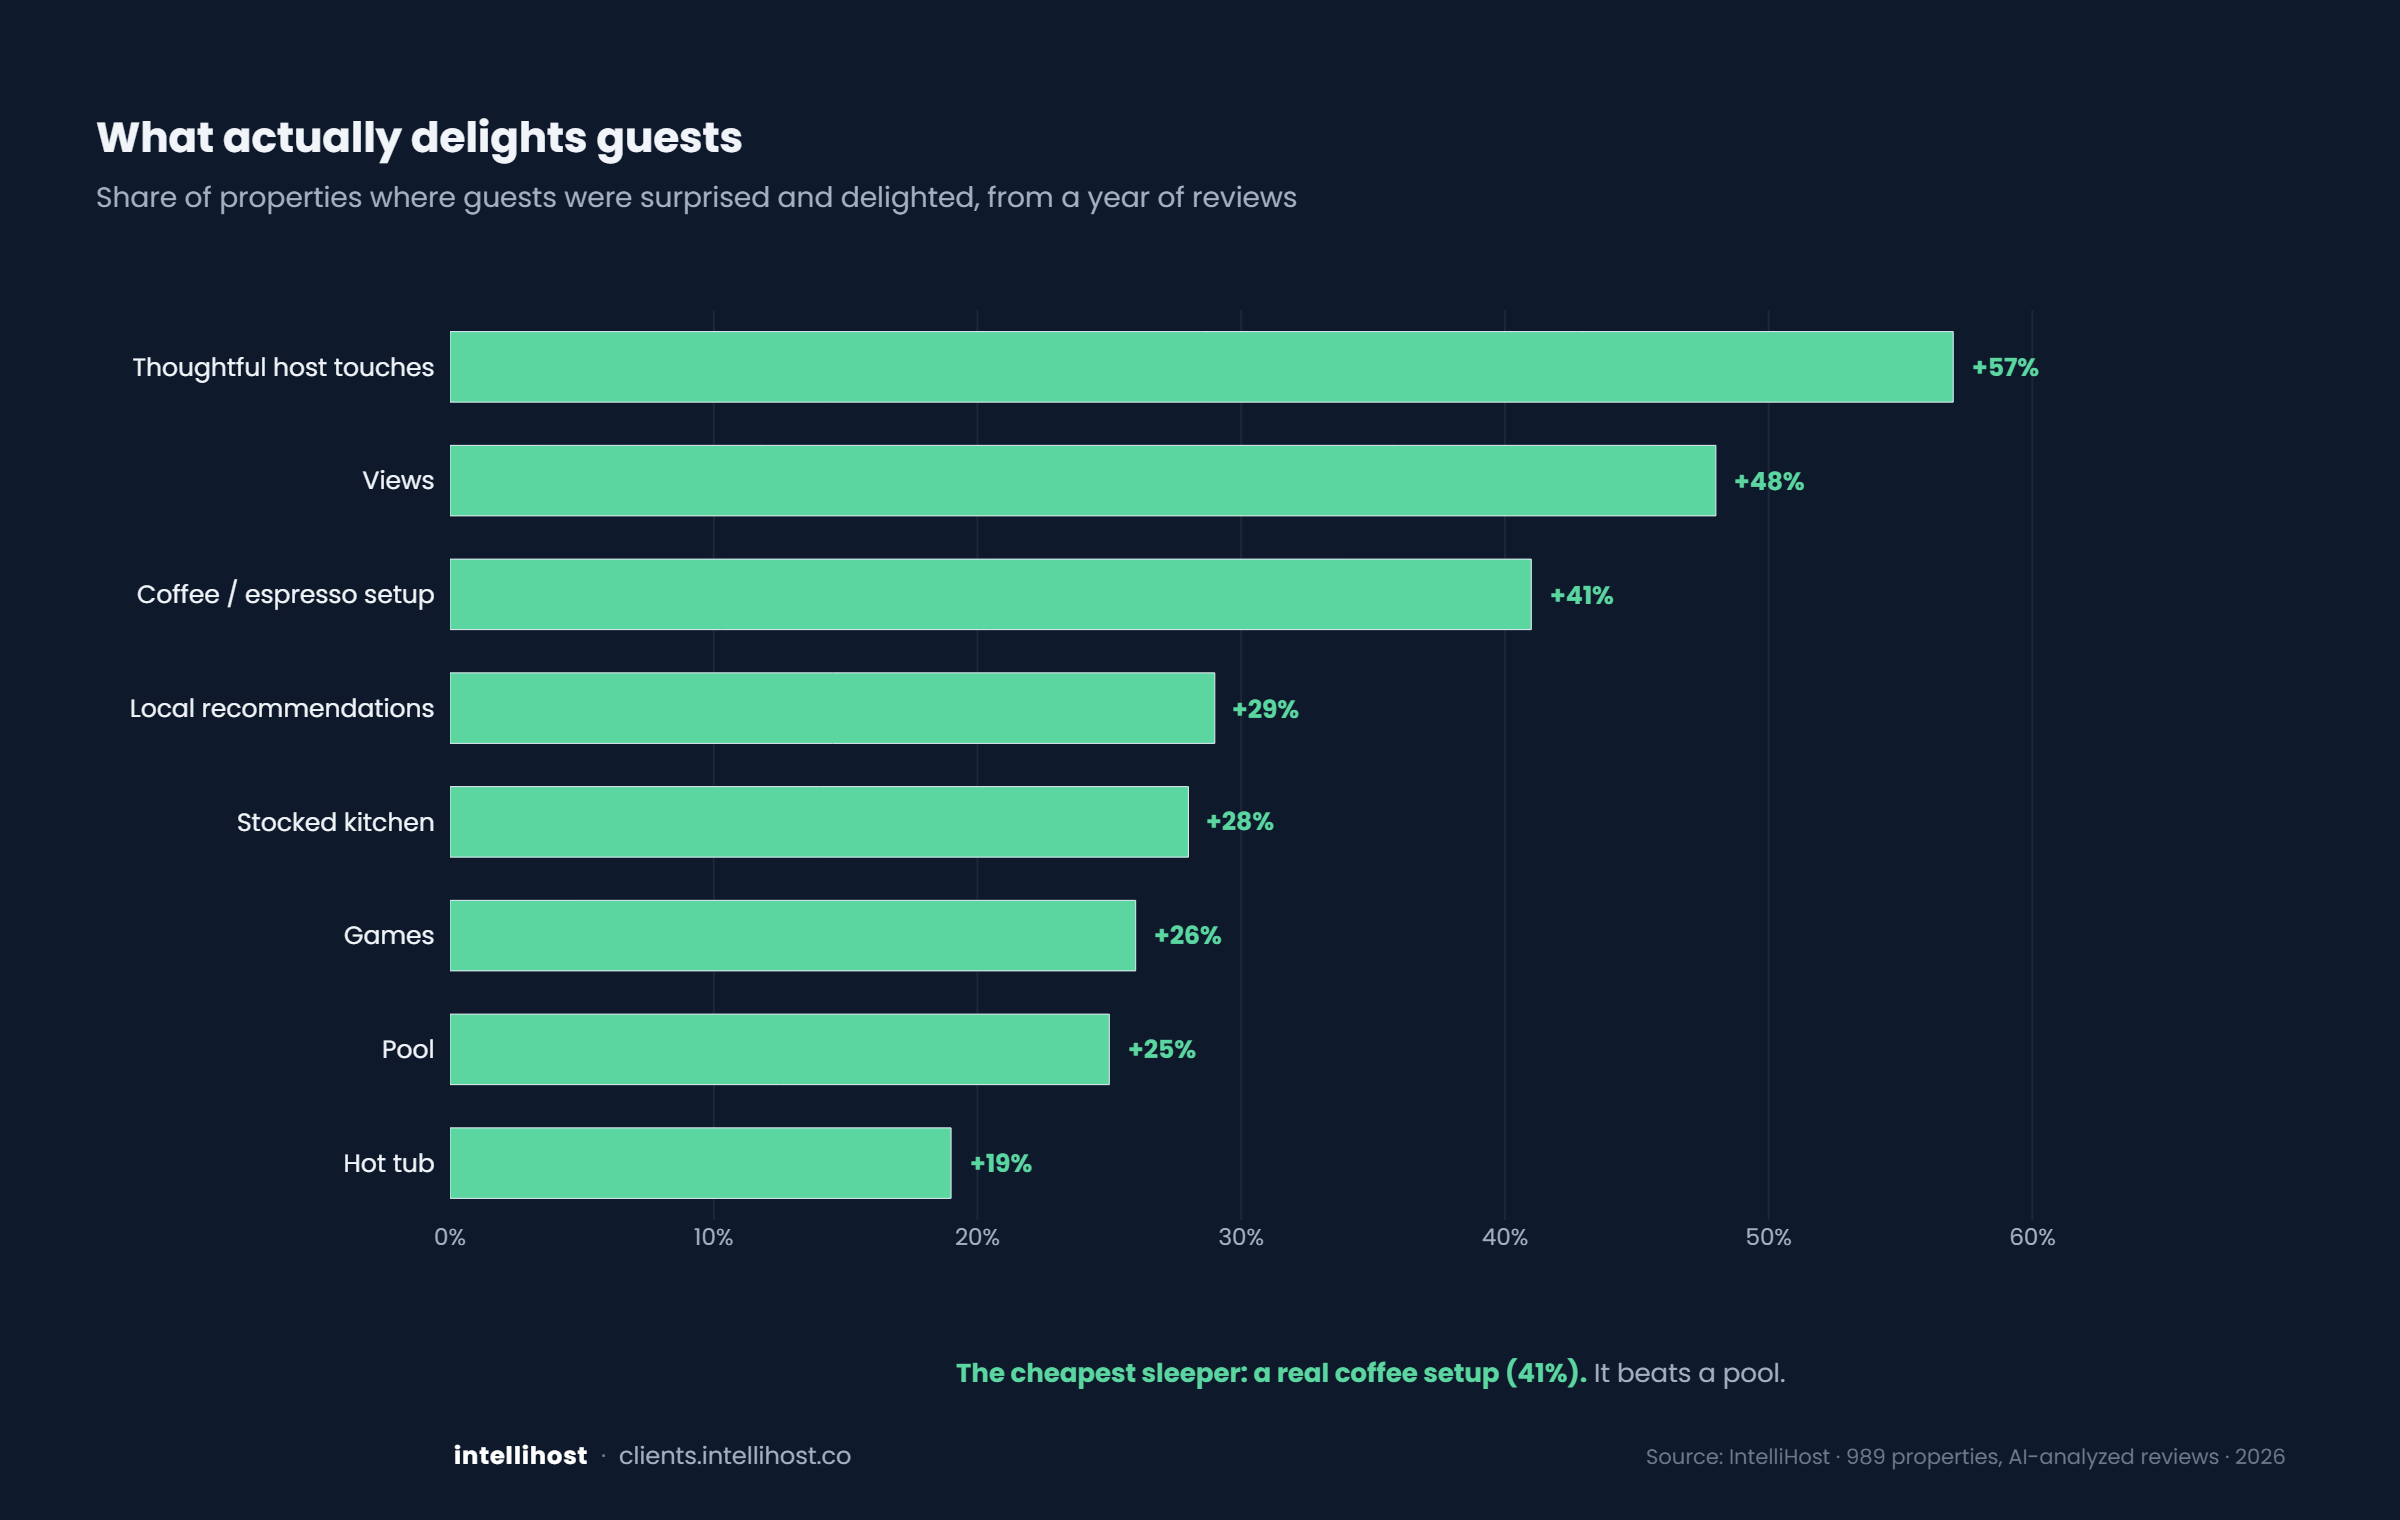
What actually delights guests
We ran a year of reviews through AI.
Listing craft
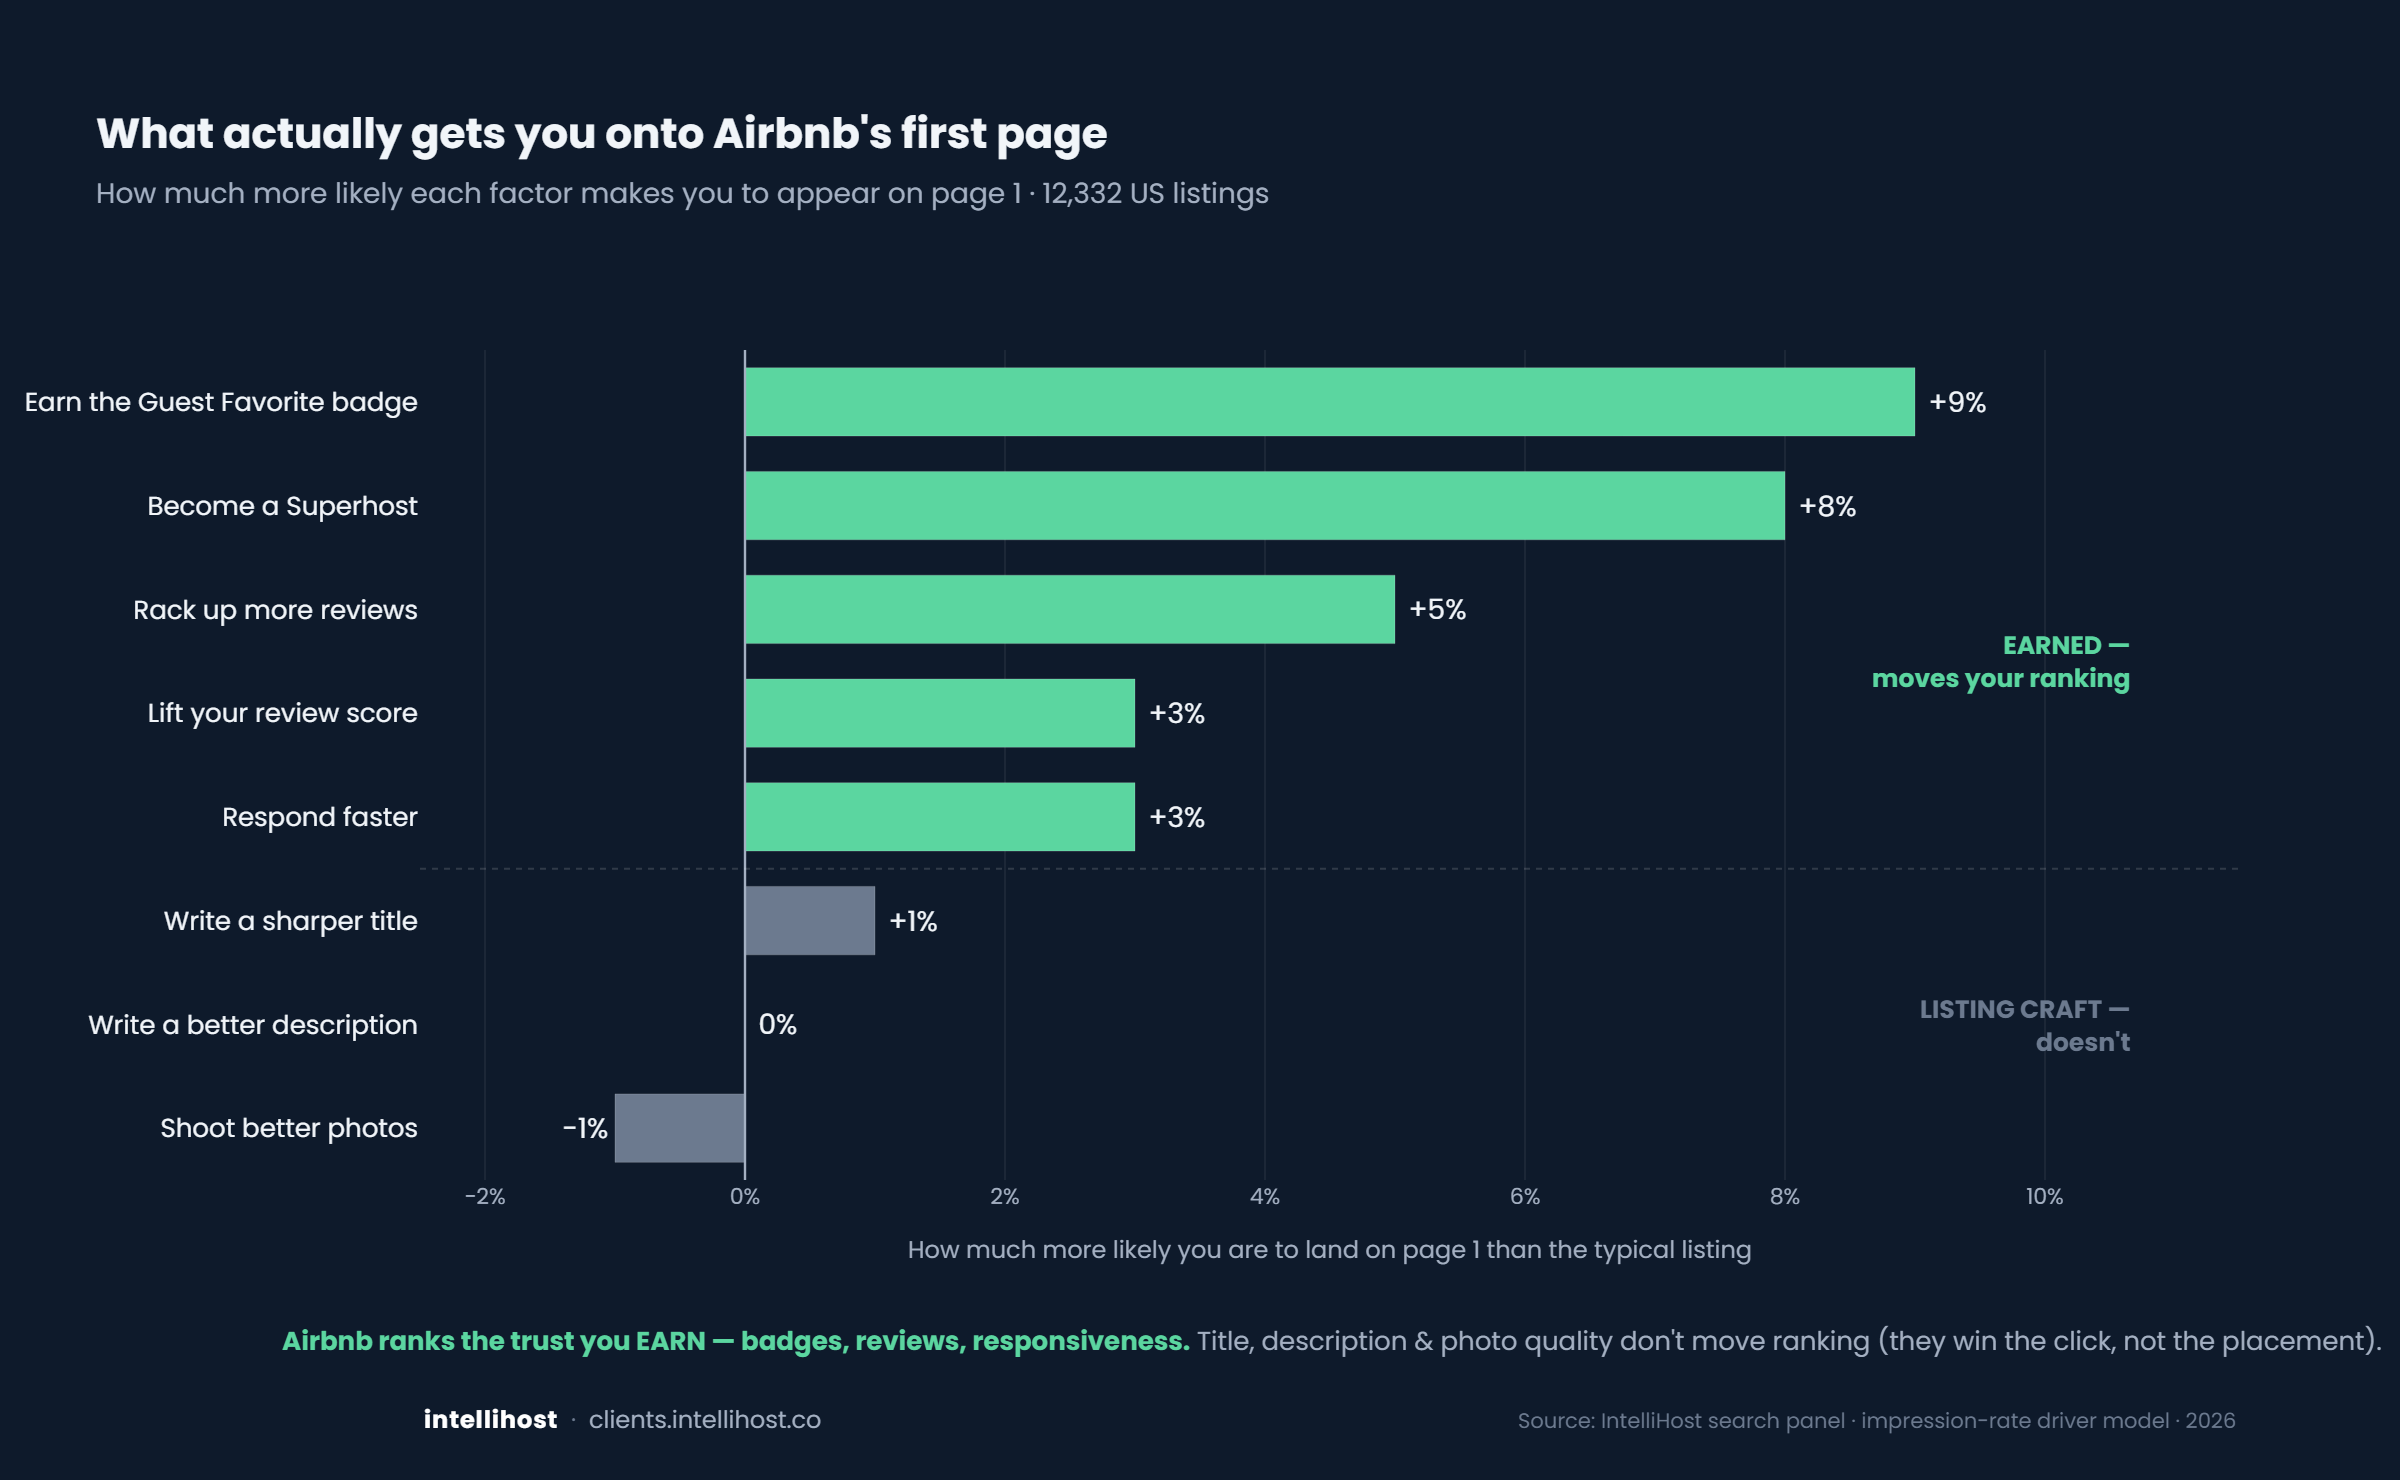
What actually gets you onto Airbnb's first page
Earned trust, not listing craft.
Property
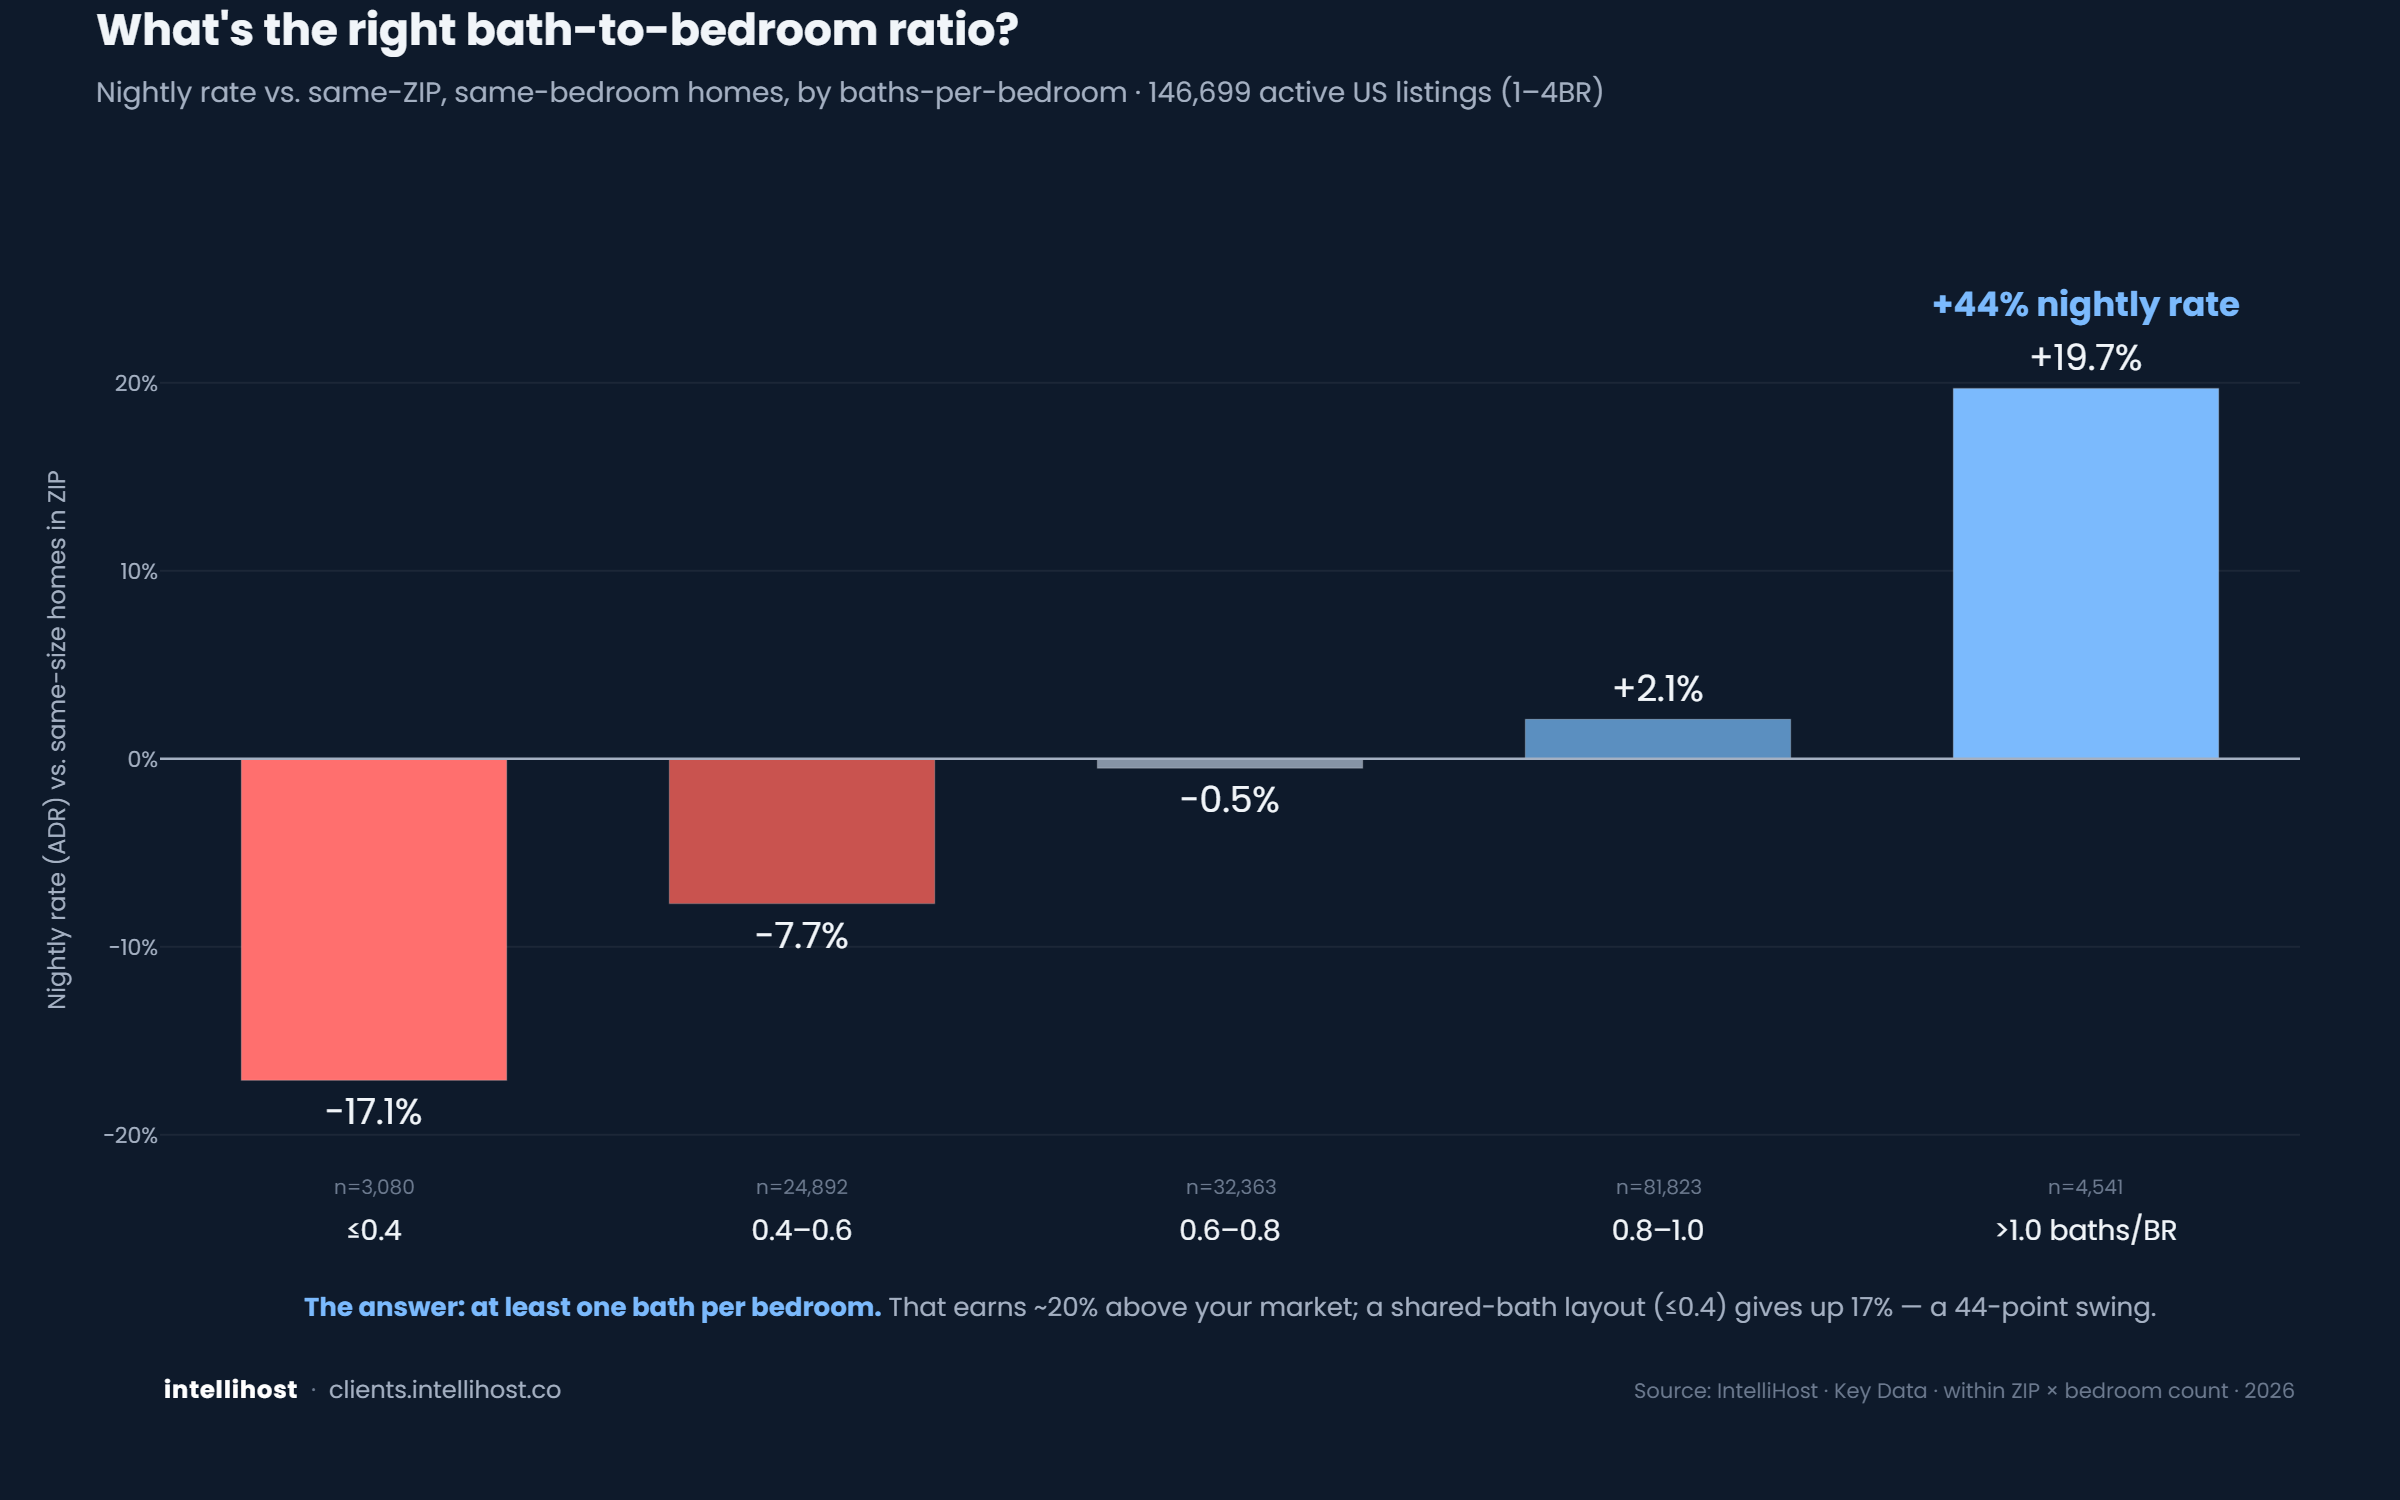
What's the right bath-to-bed ratio?
The ratio matters more than the count.
Market
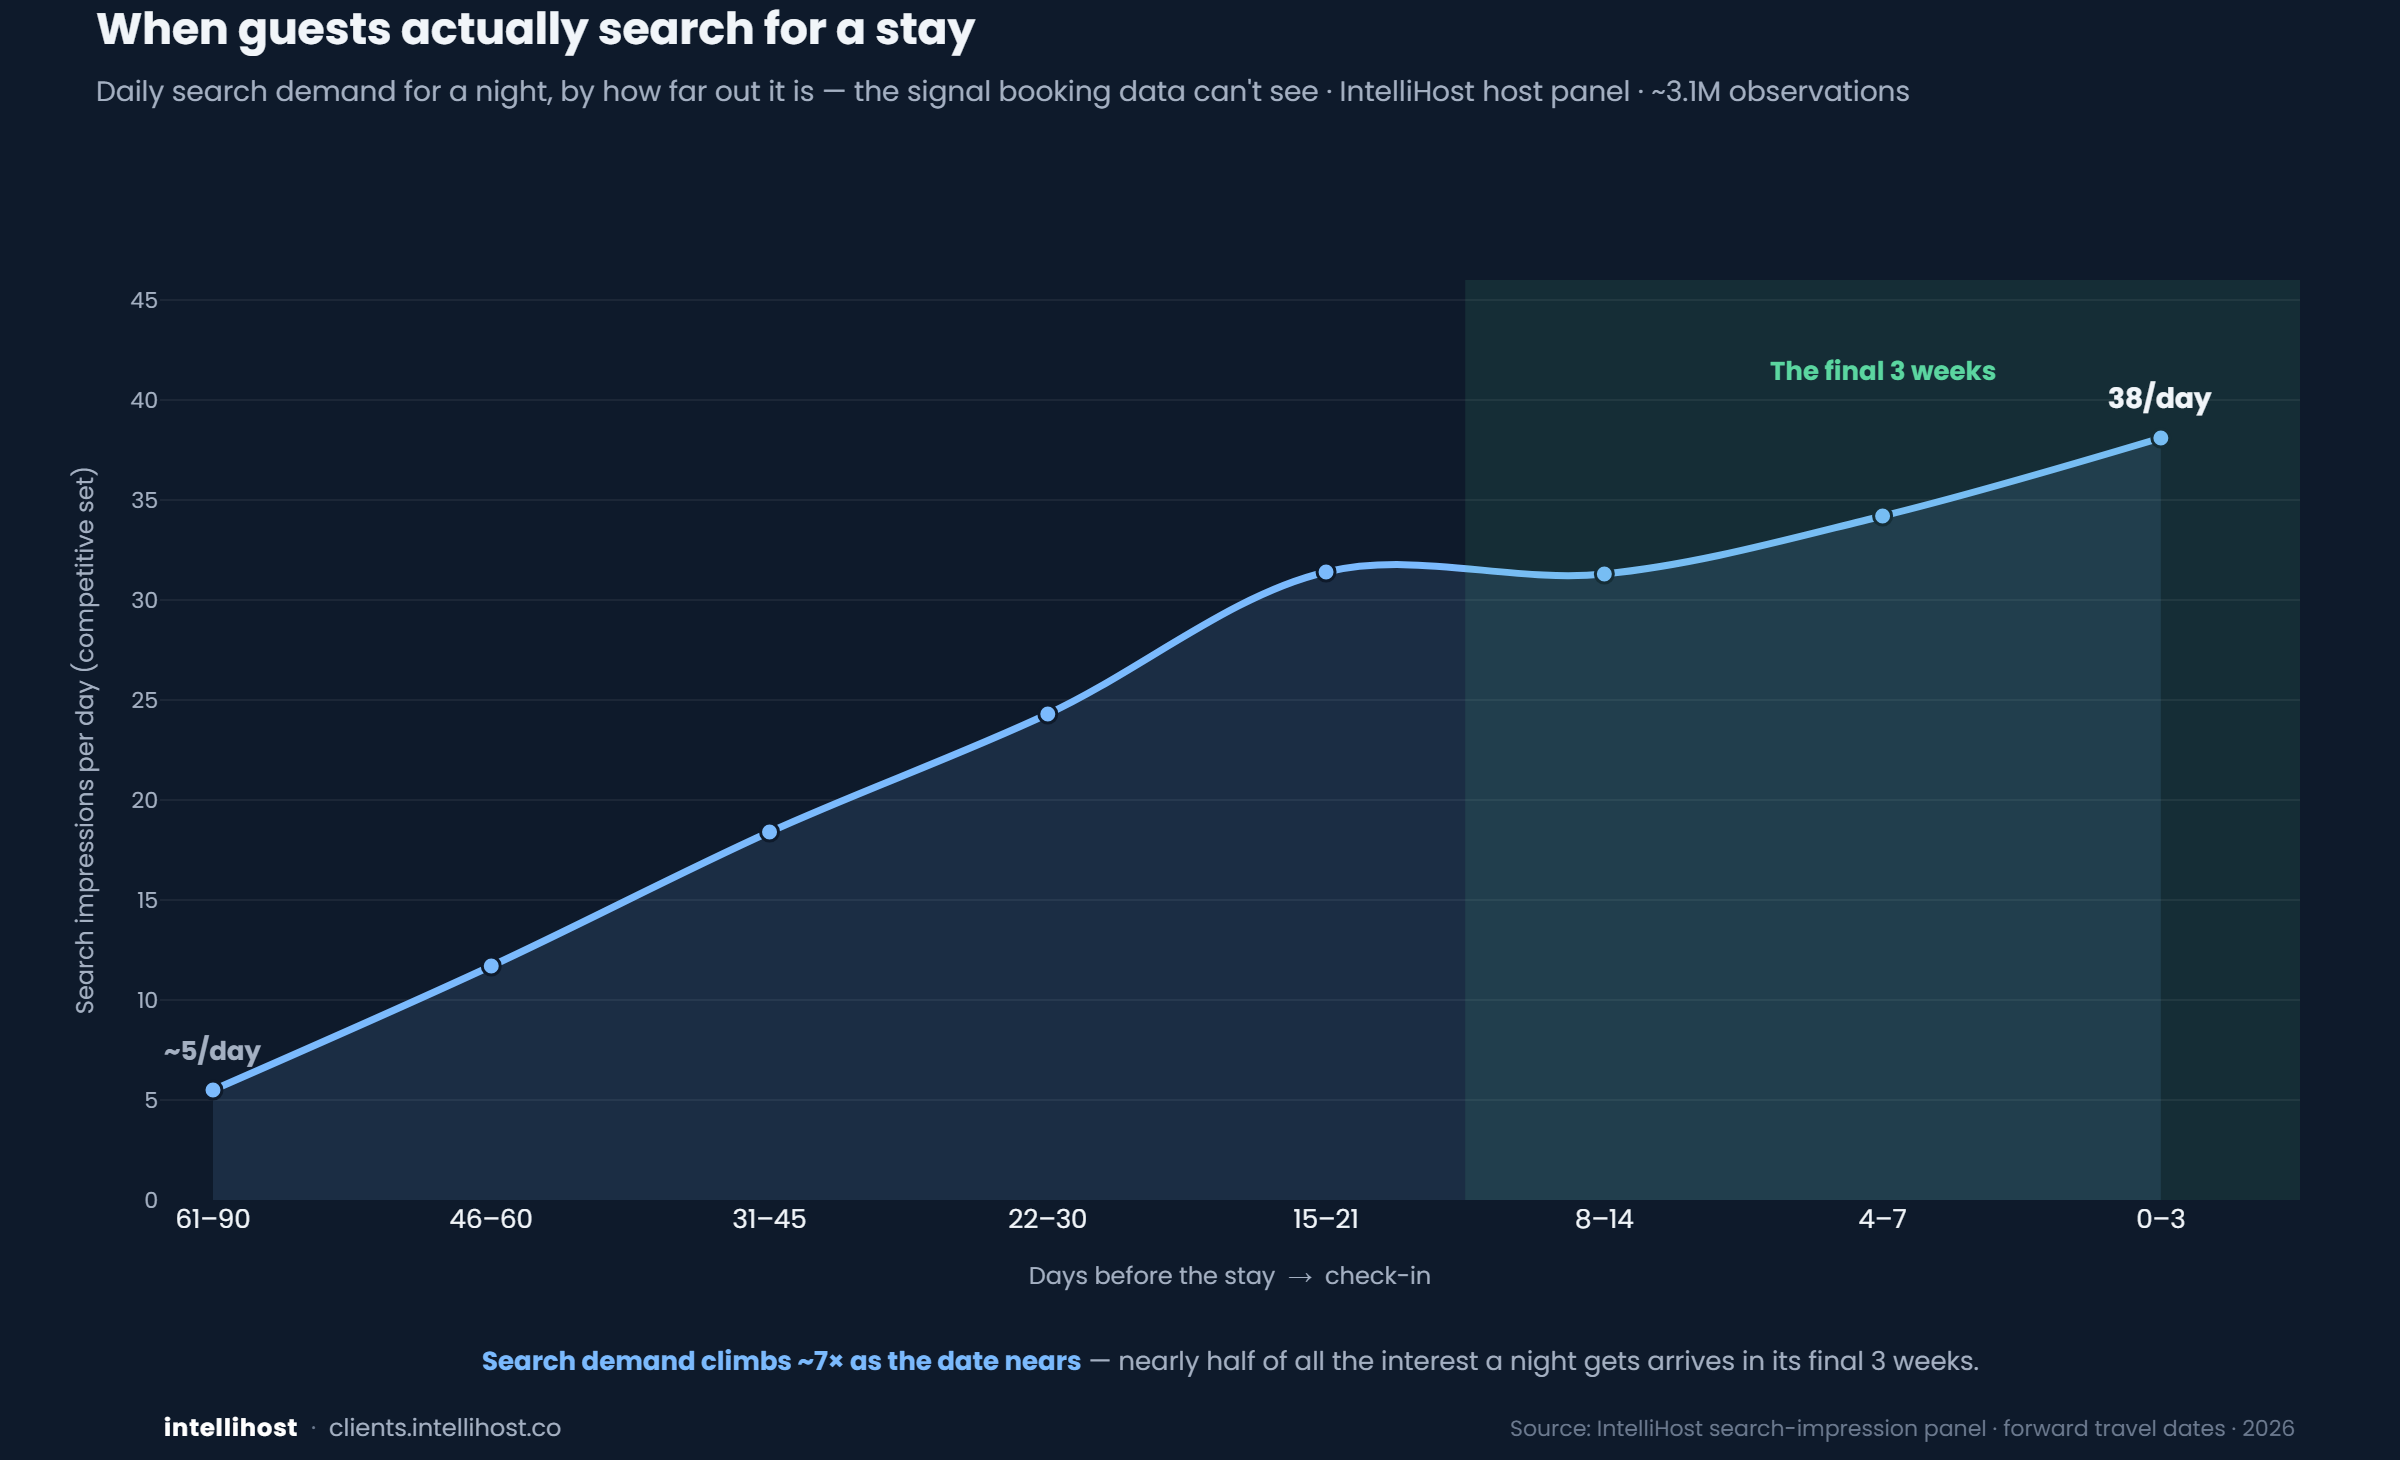
When guests actually search
The shopping happens late.
Market
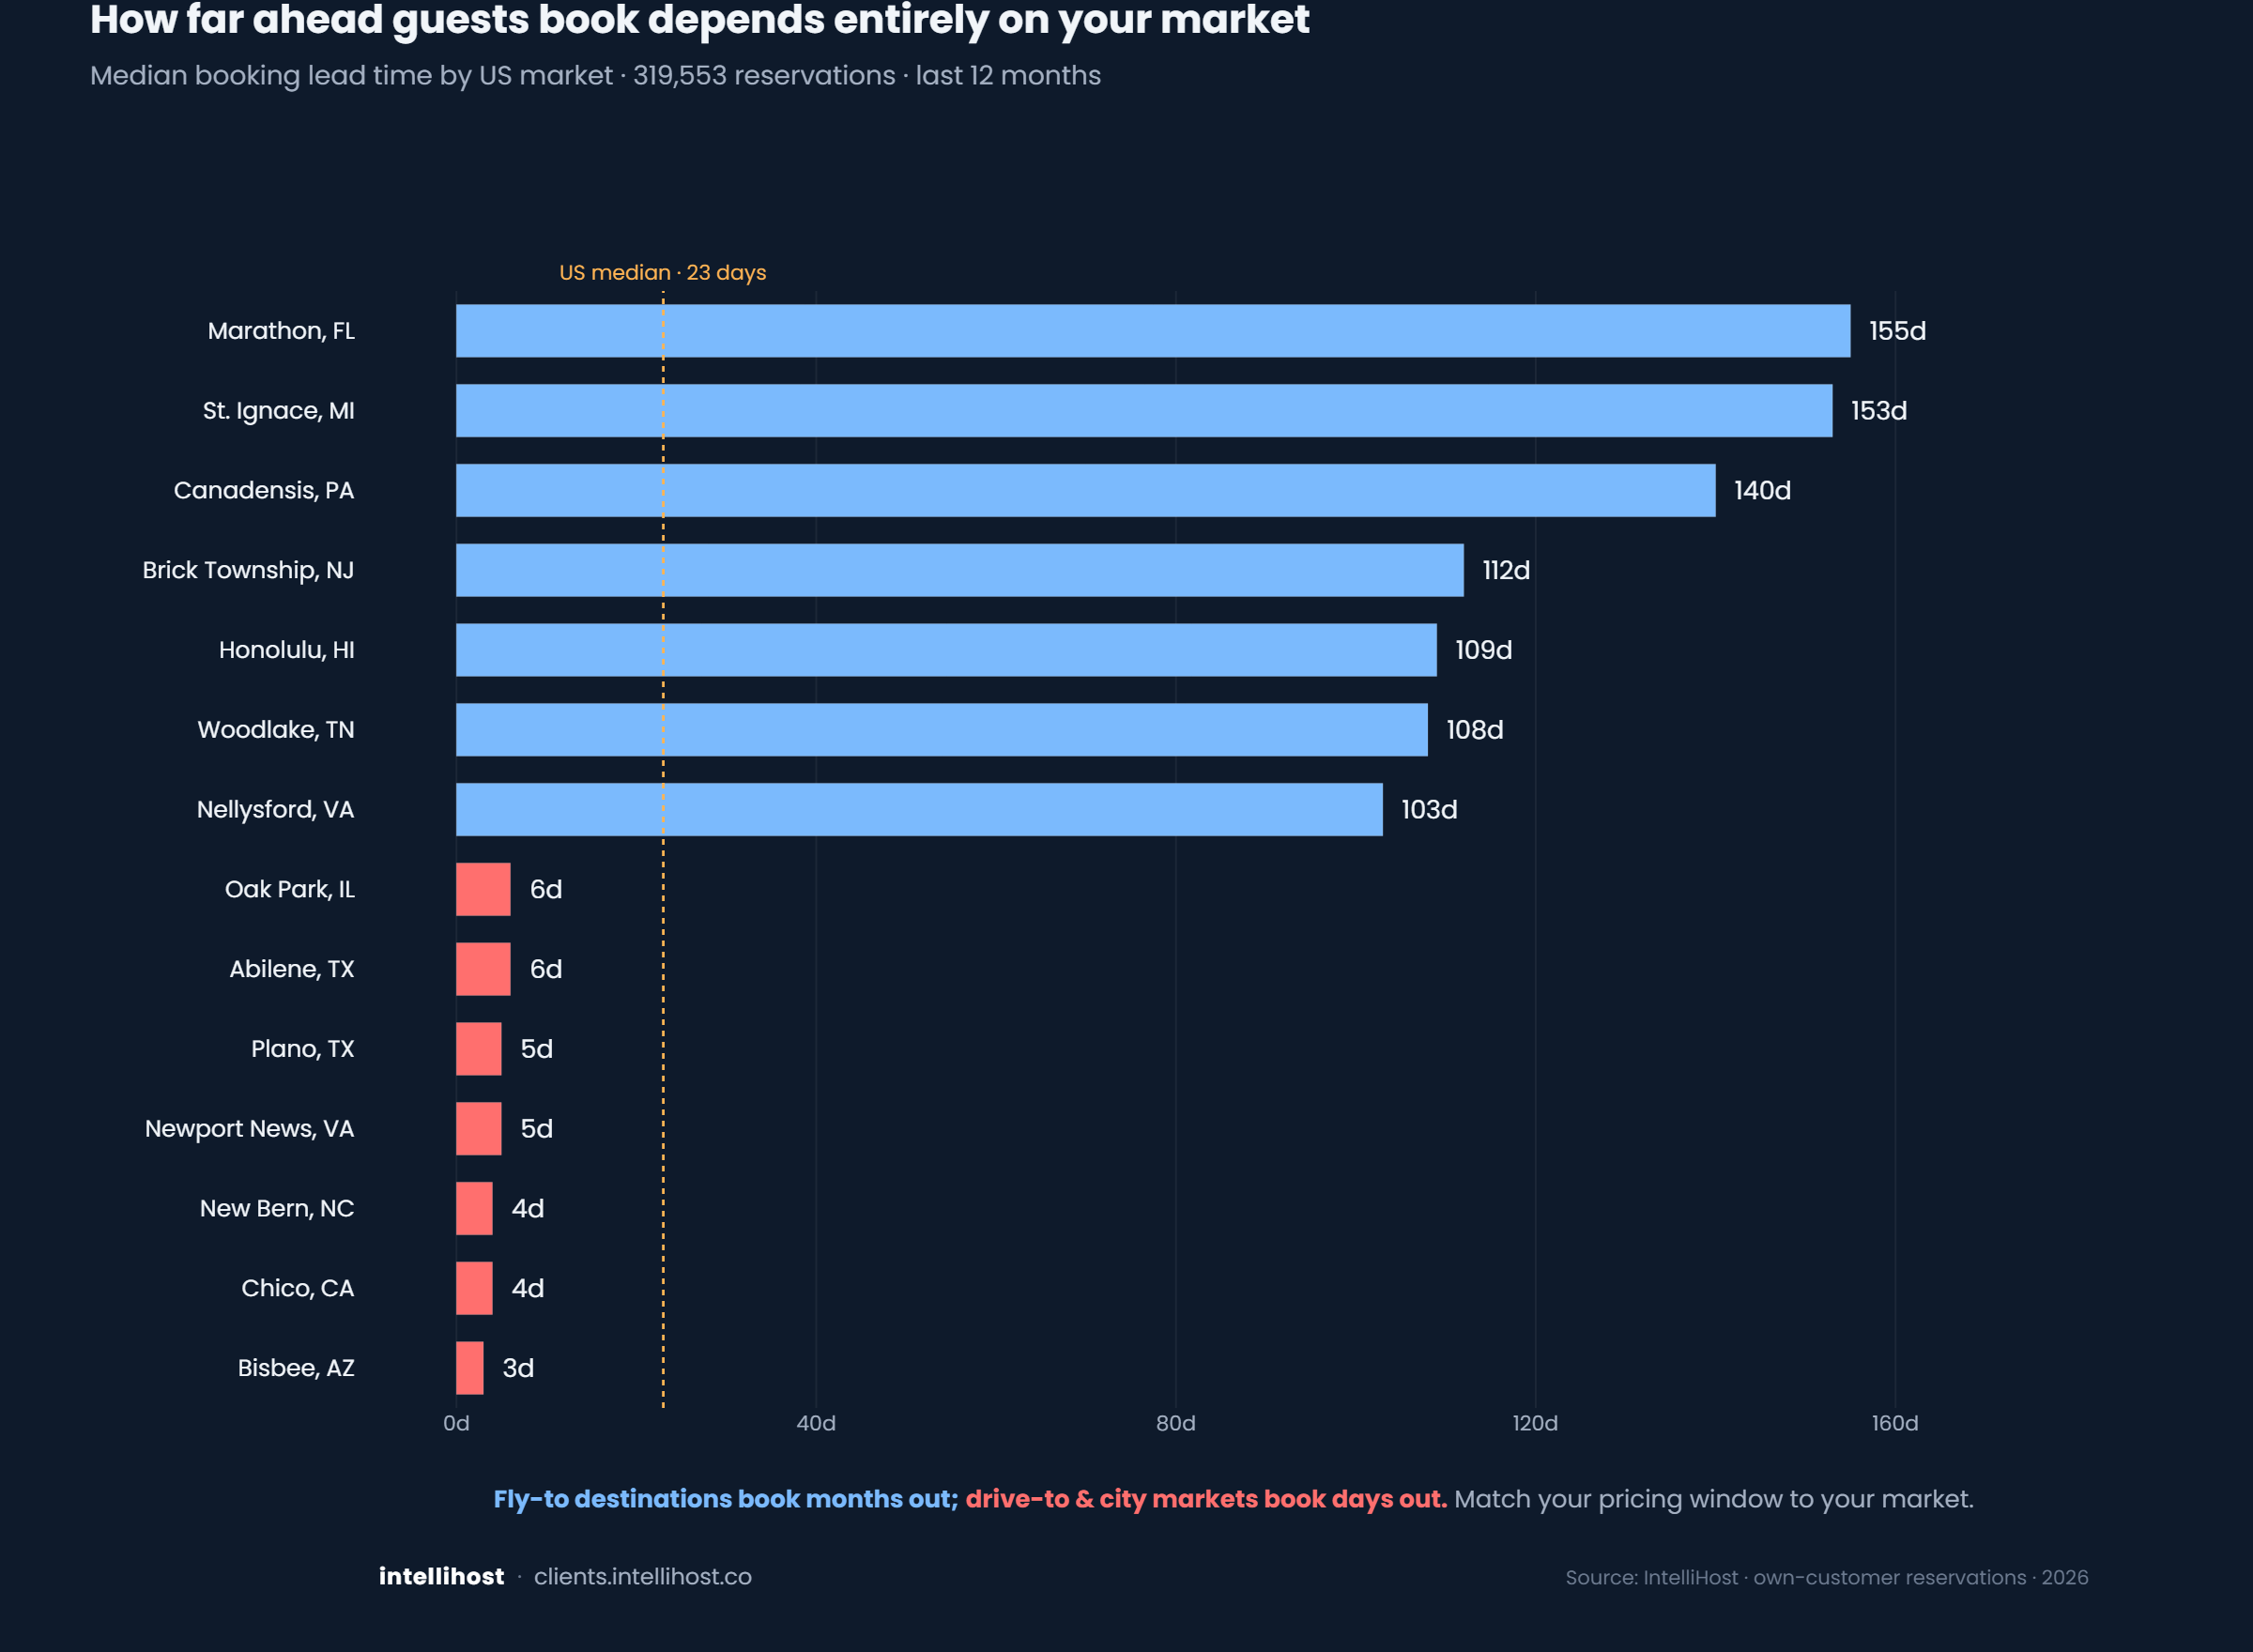
When should I drop my price? It depends where you host
Booking lead time swings 50x by market.
Market
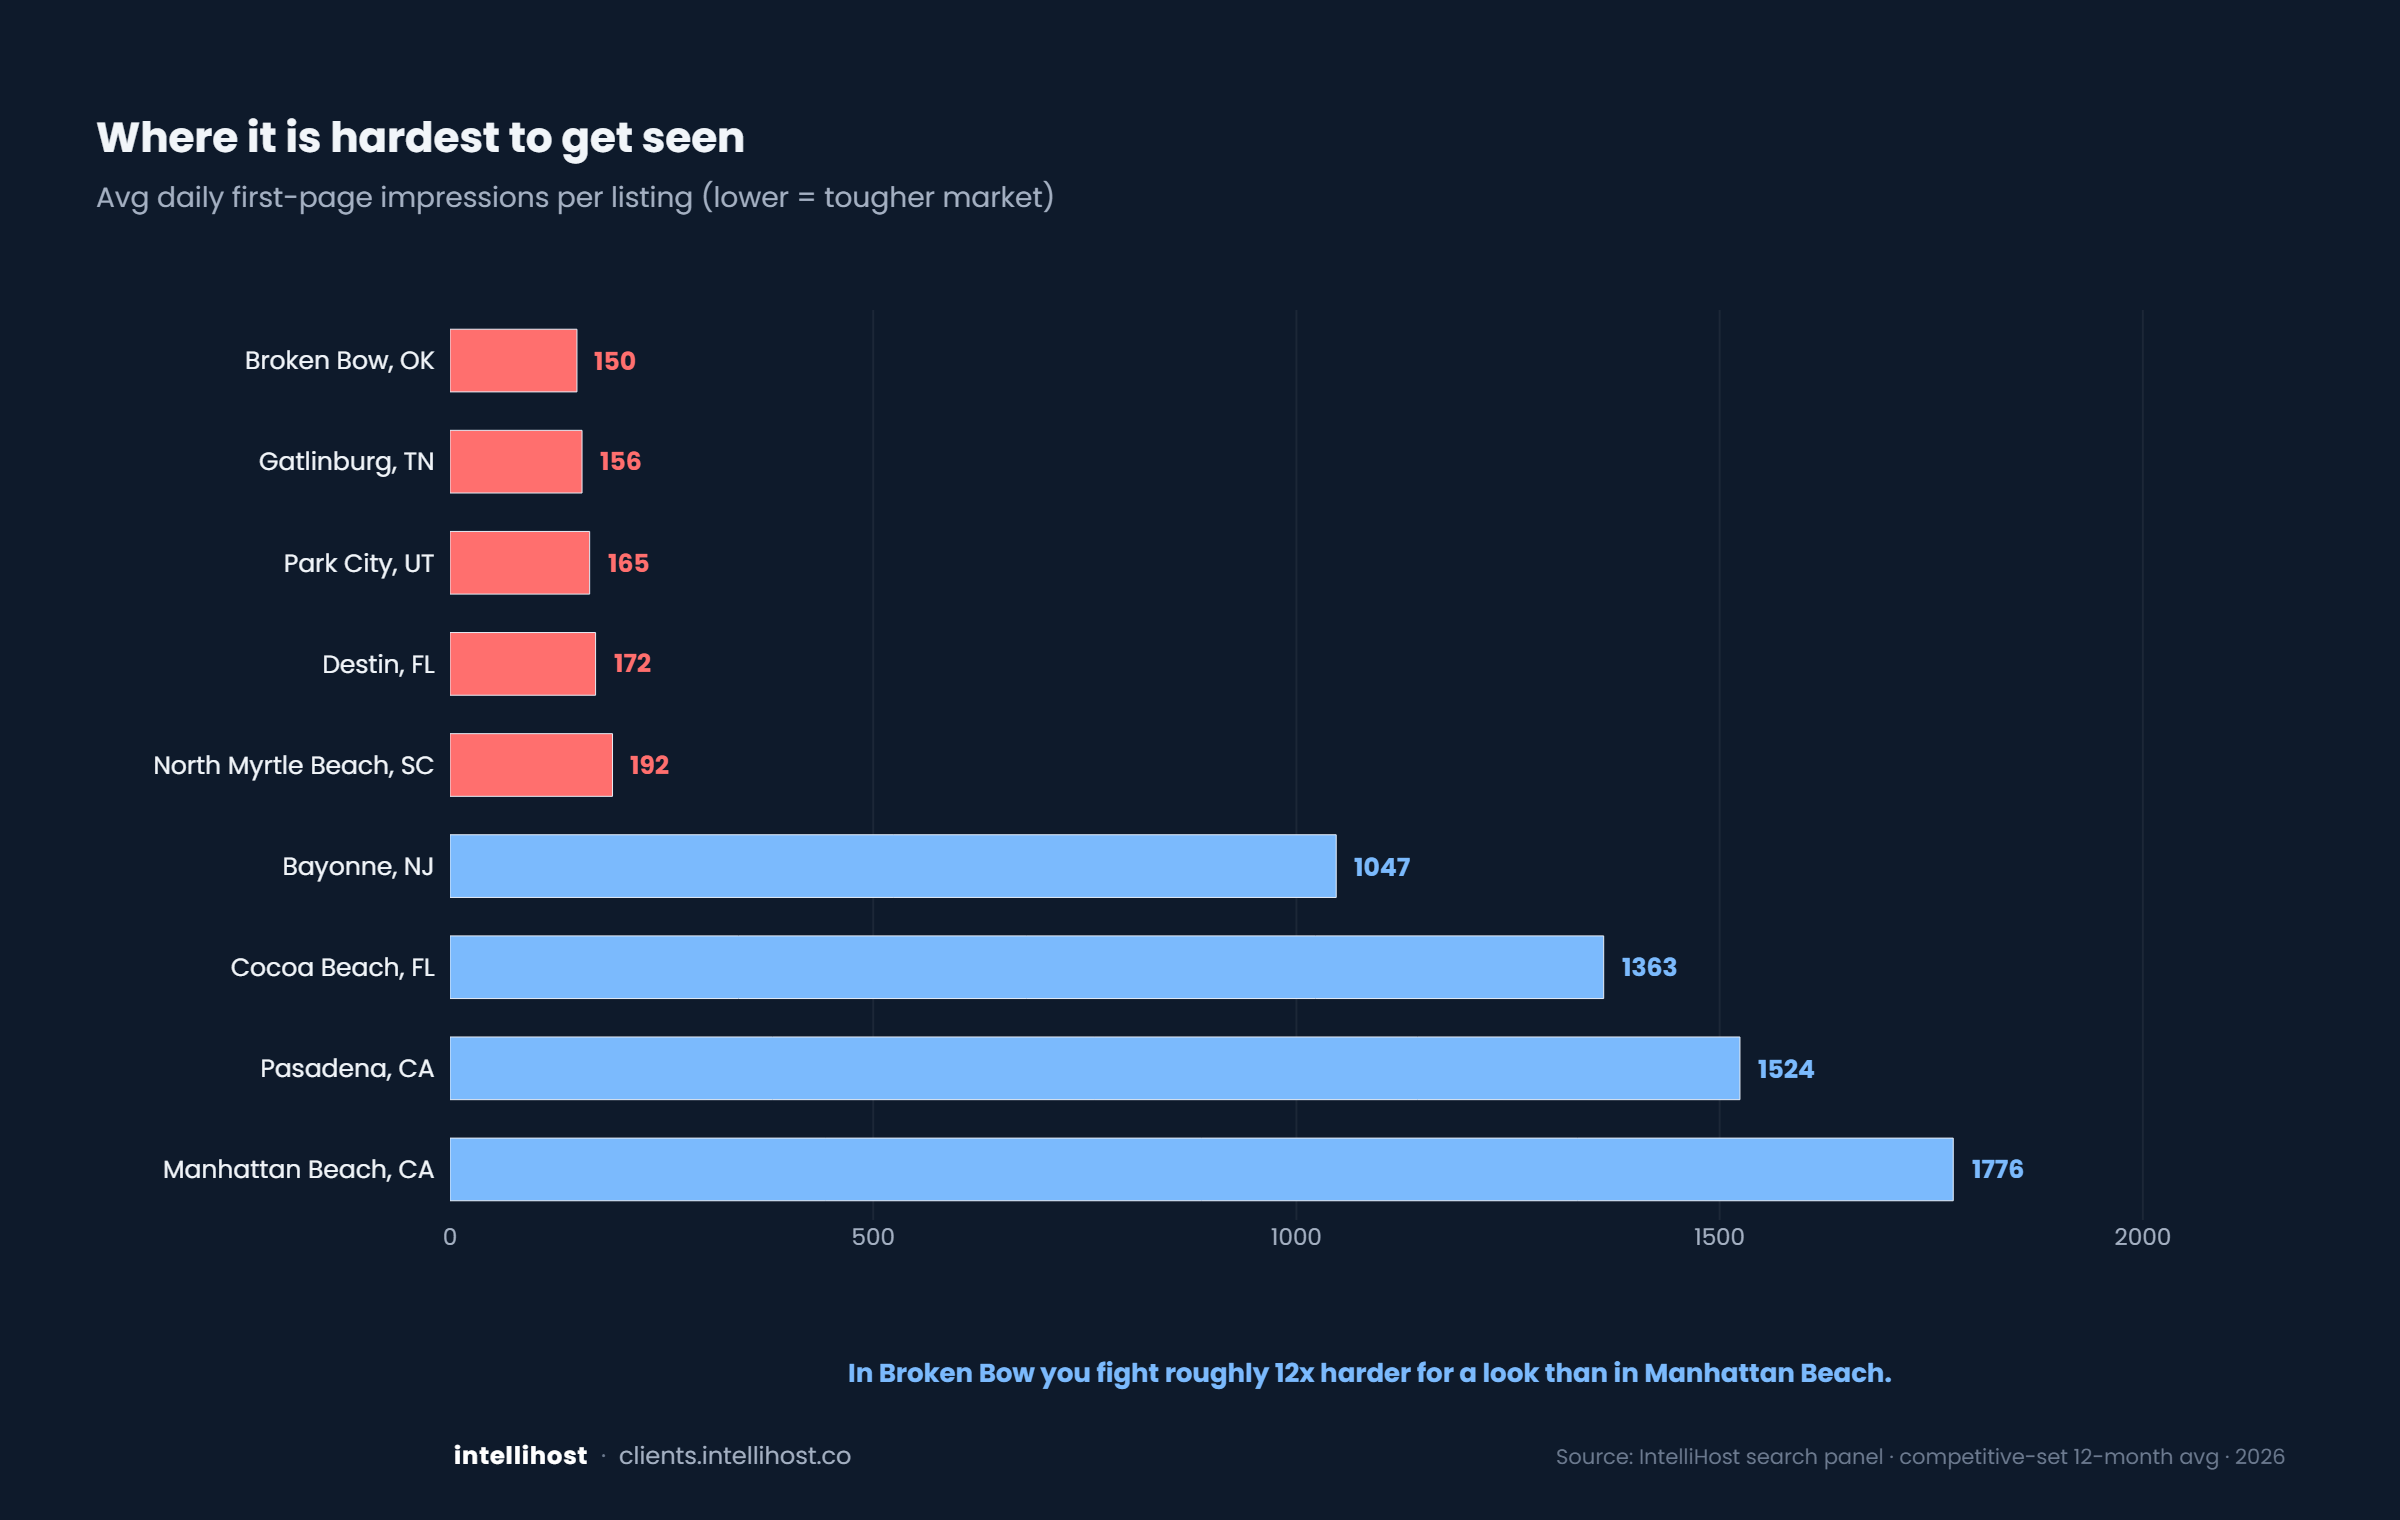
Where it is hardest to get seen
Some markets are 12x tougher than others.
Pricing
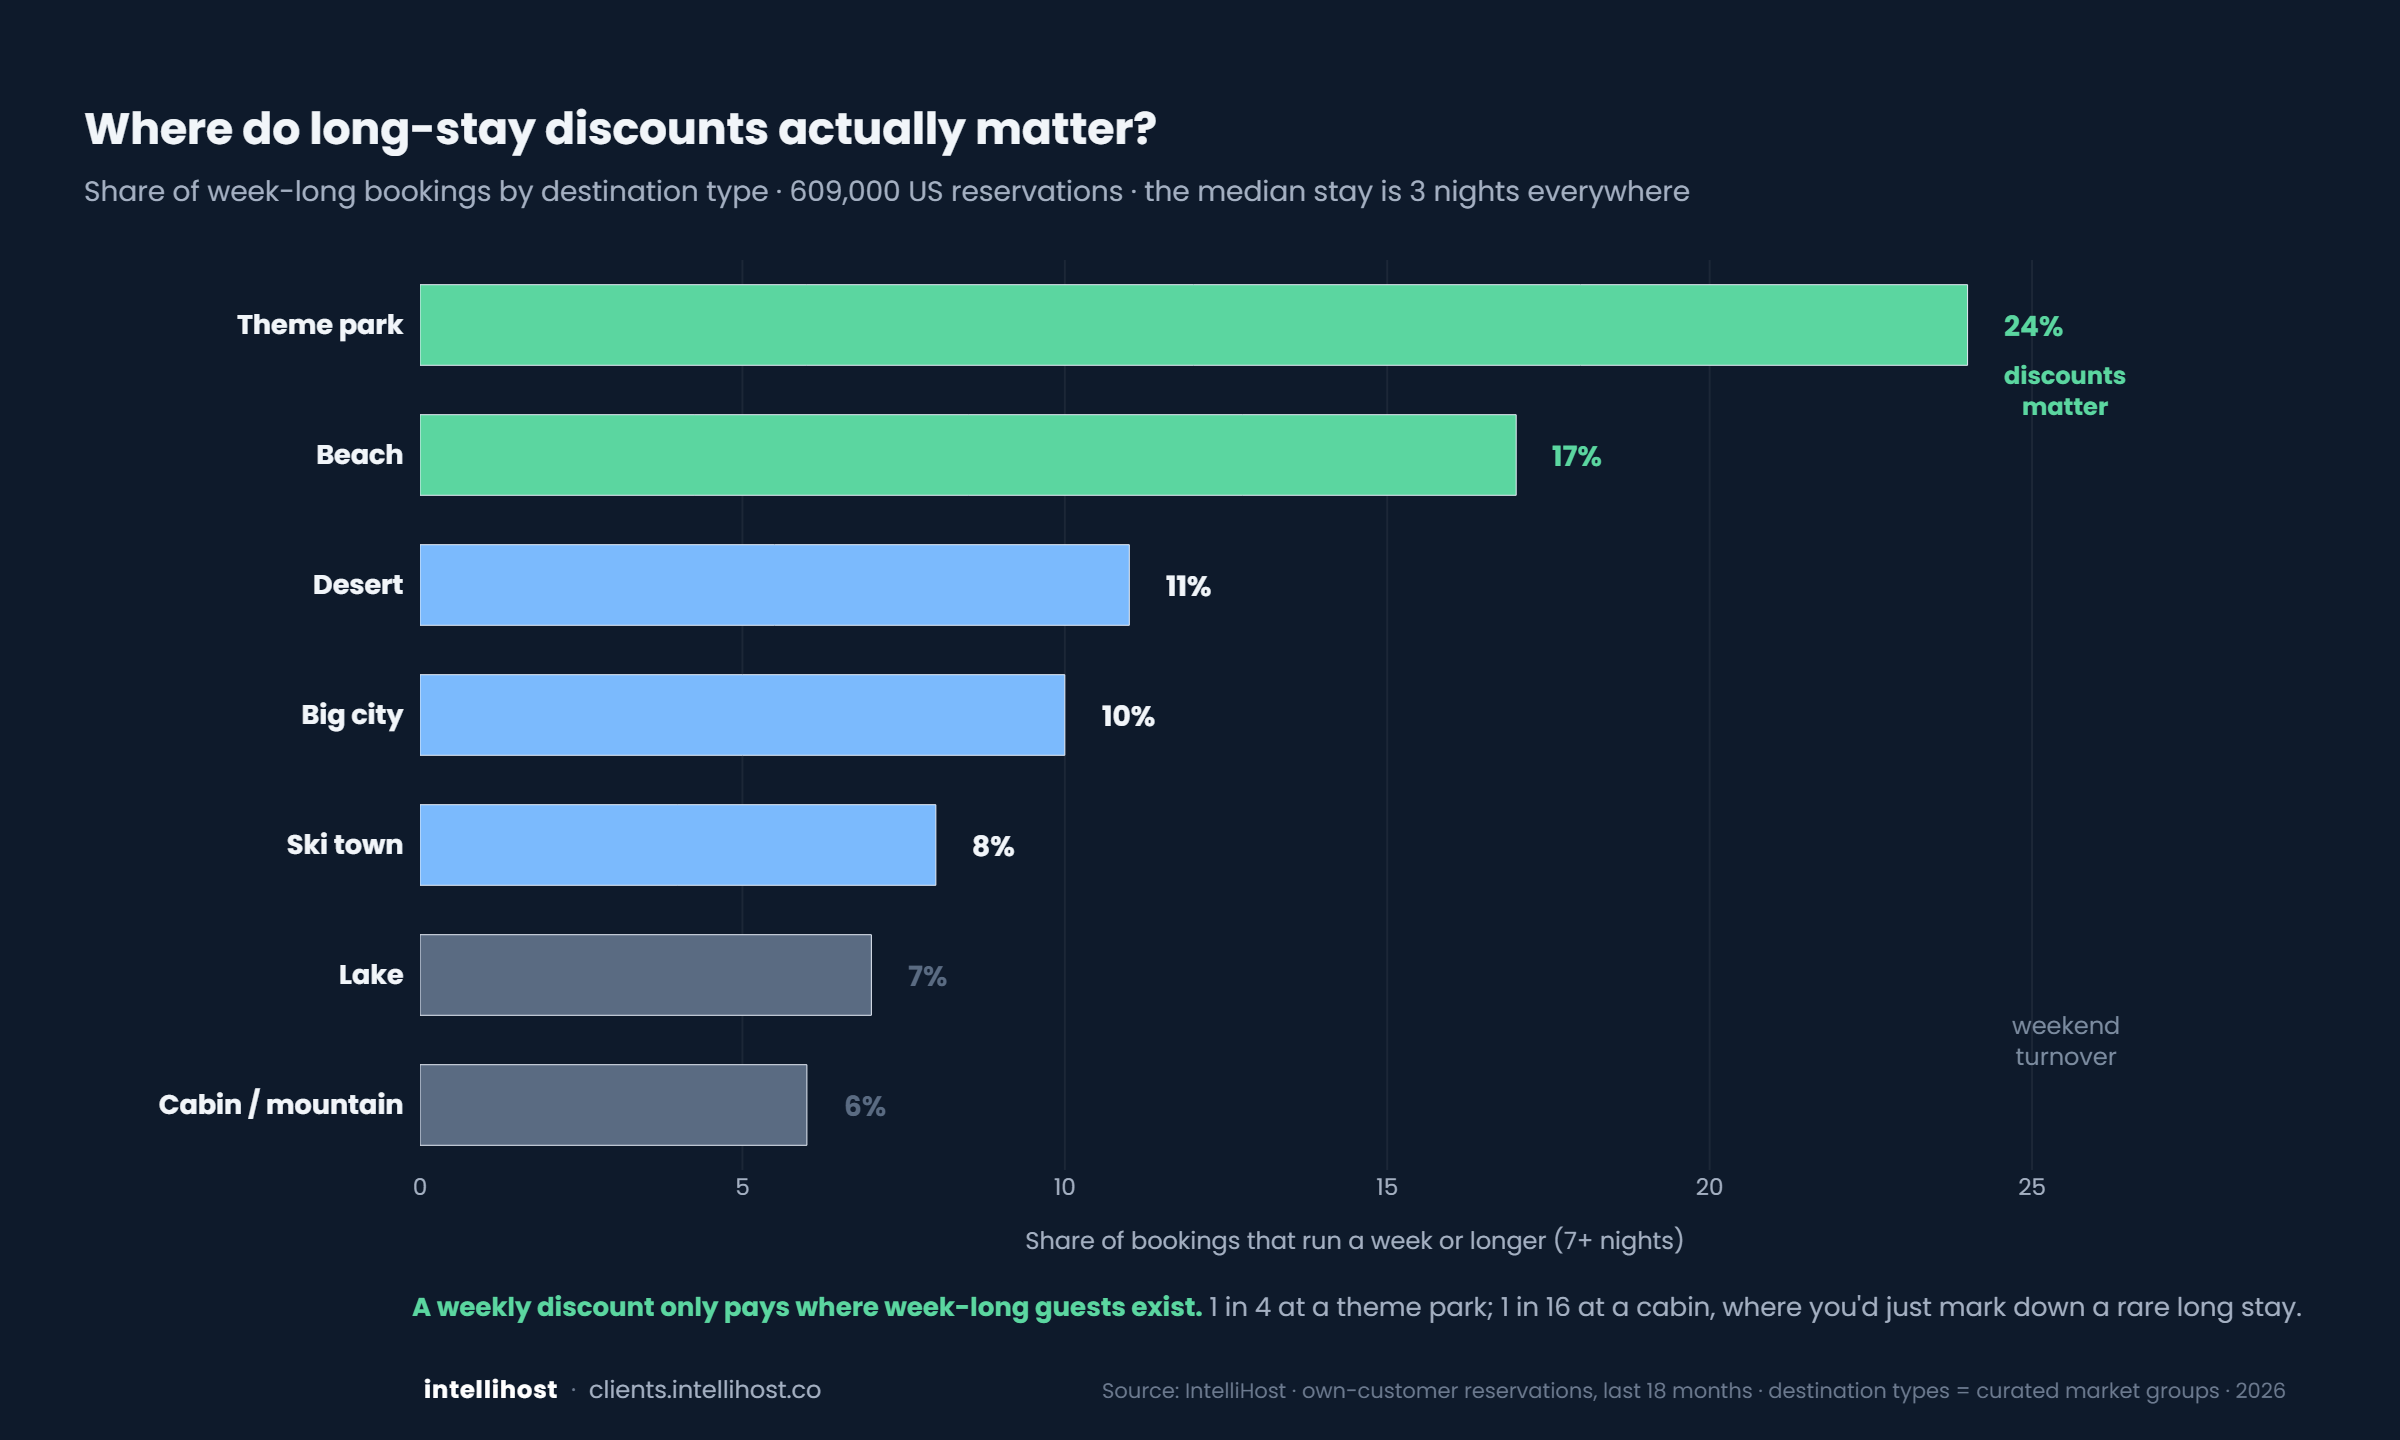
Where long-stay discounts actually matter
It's about your ZIP, not your listing.
Property
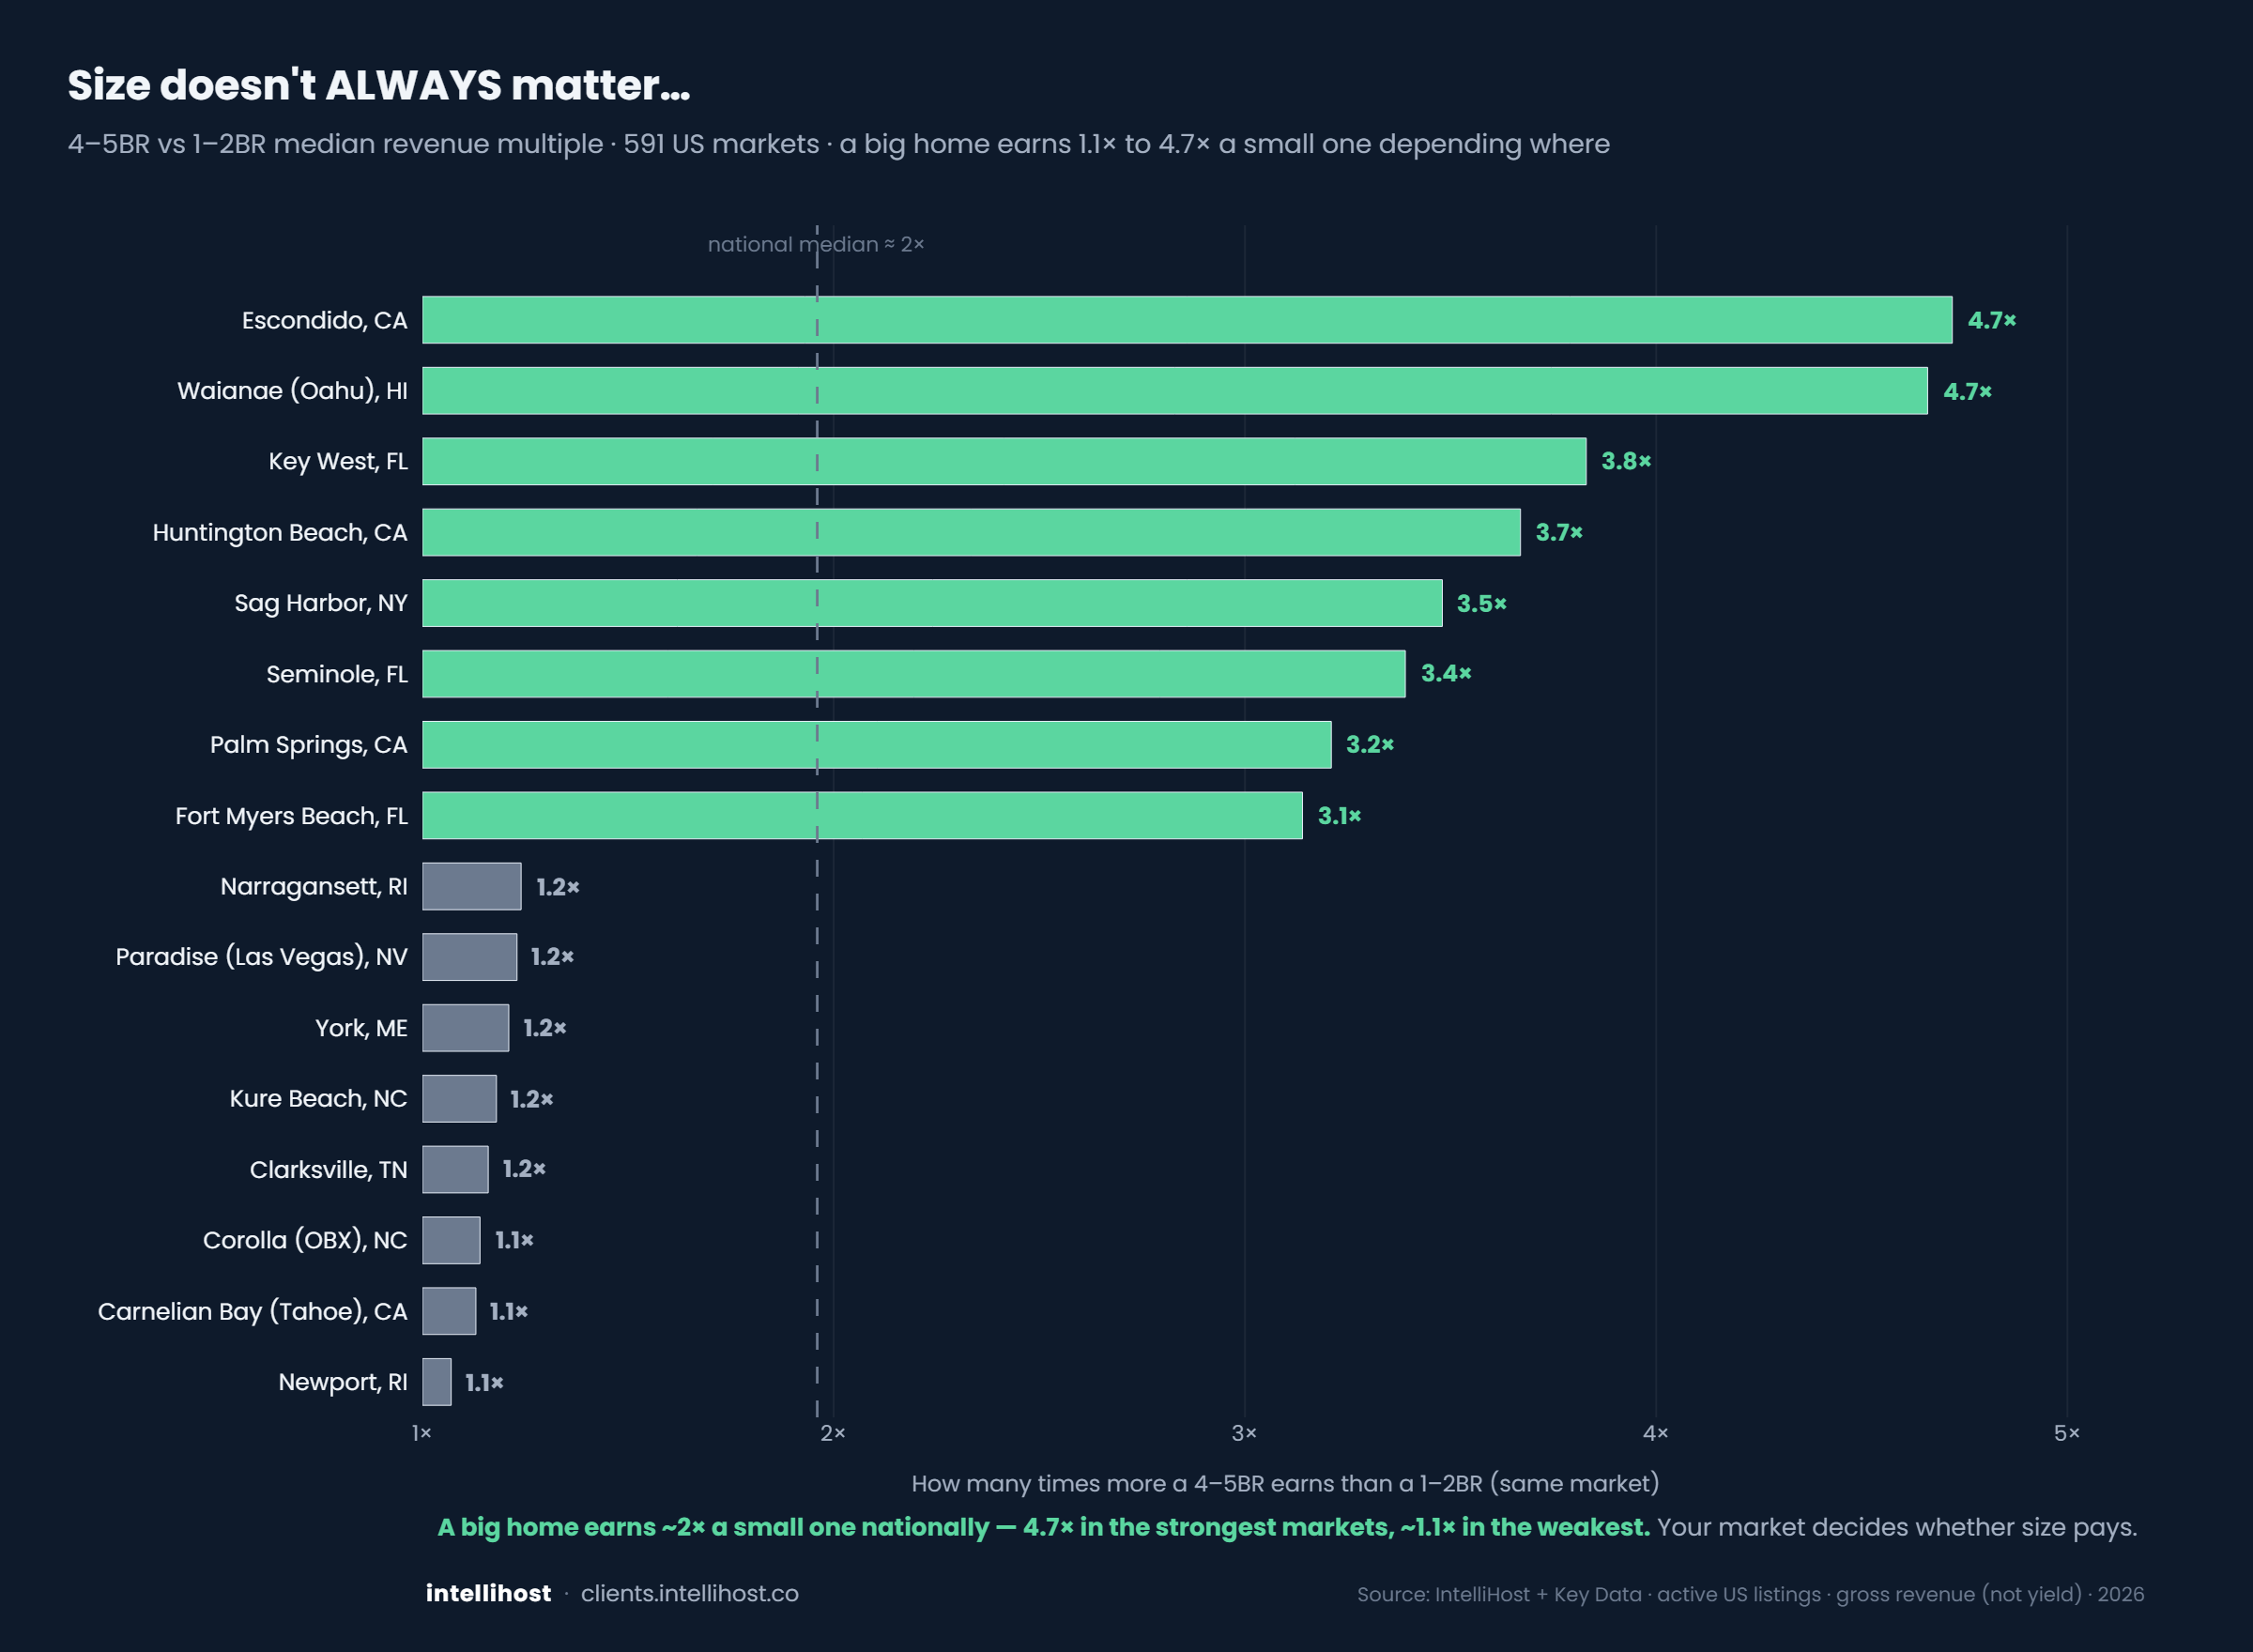
Where the big house actually pays off
Size doesn't always matter.
Operations
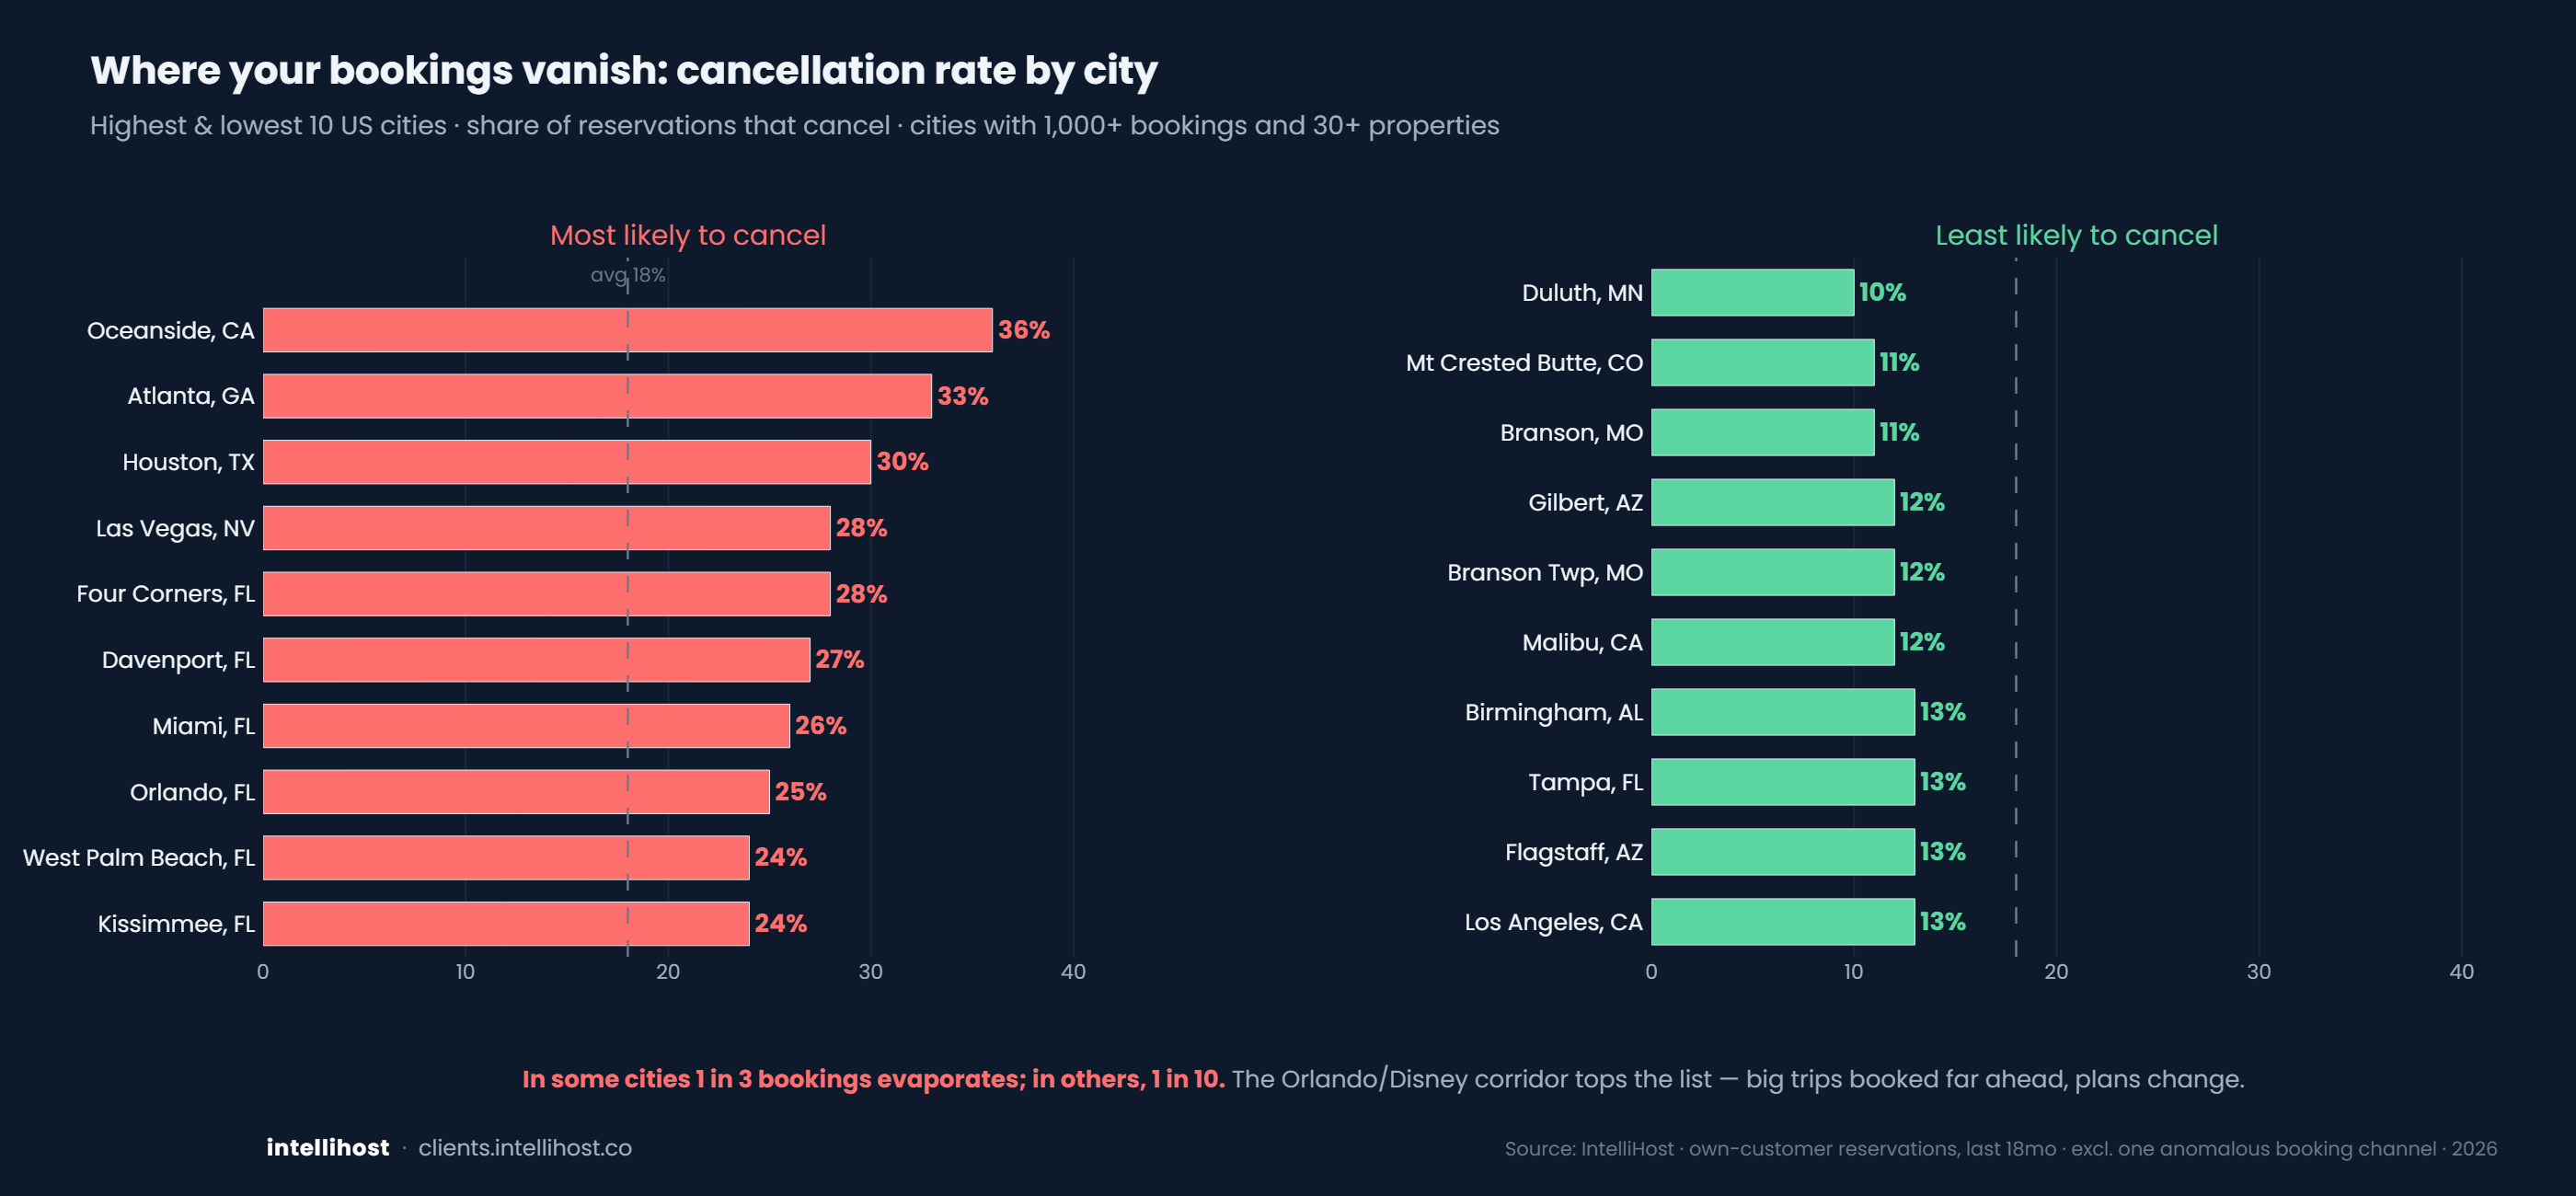
Where your bookings vanish
Cancellation rate swings 3-4x by city.
Reviews
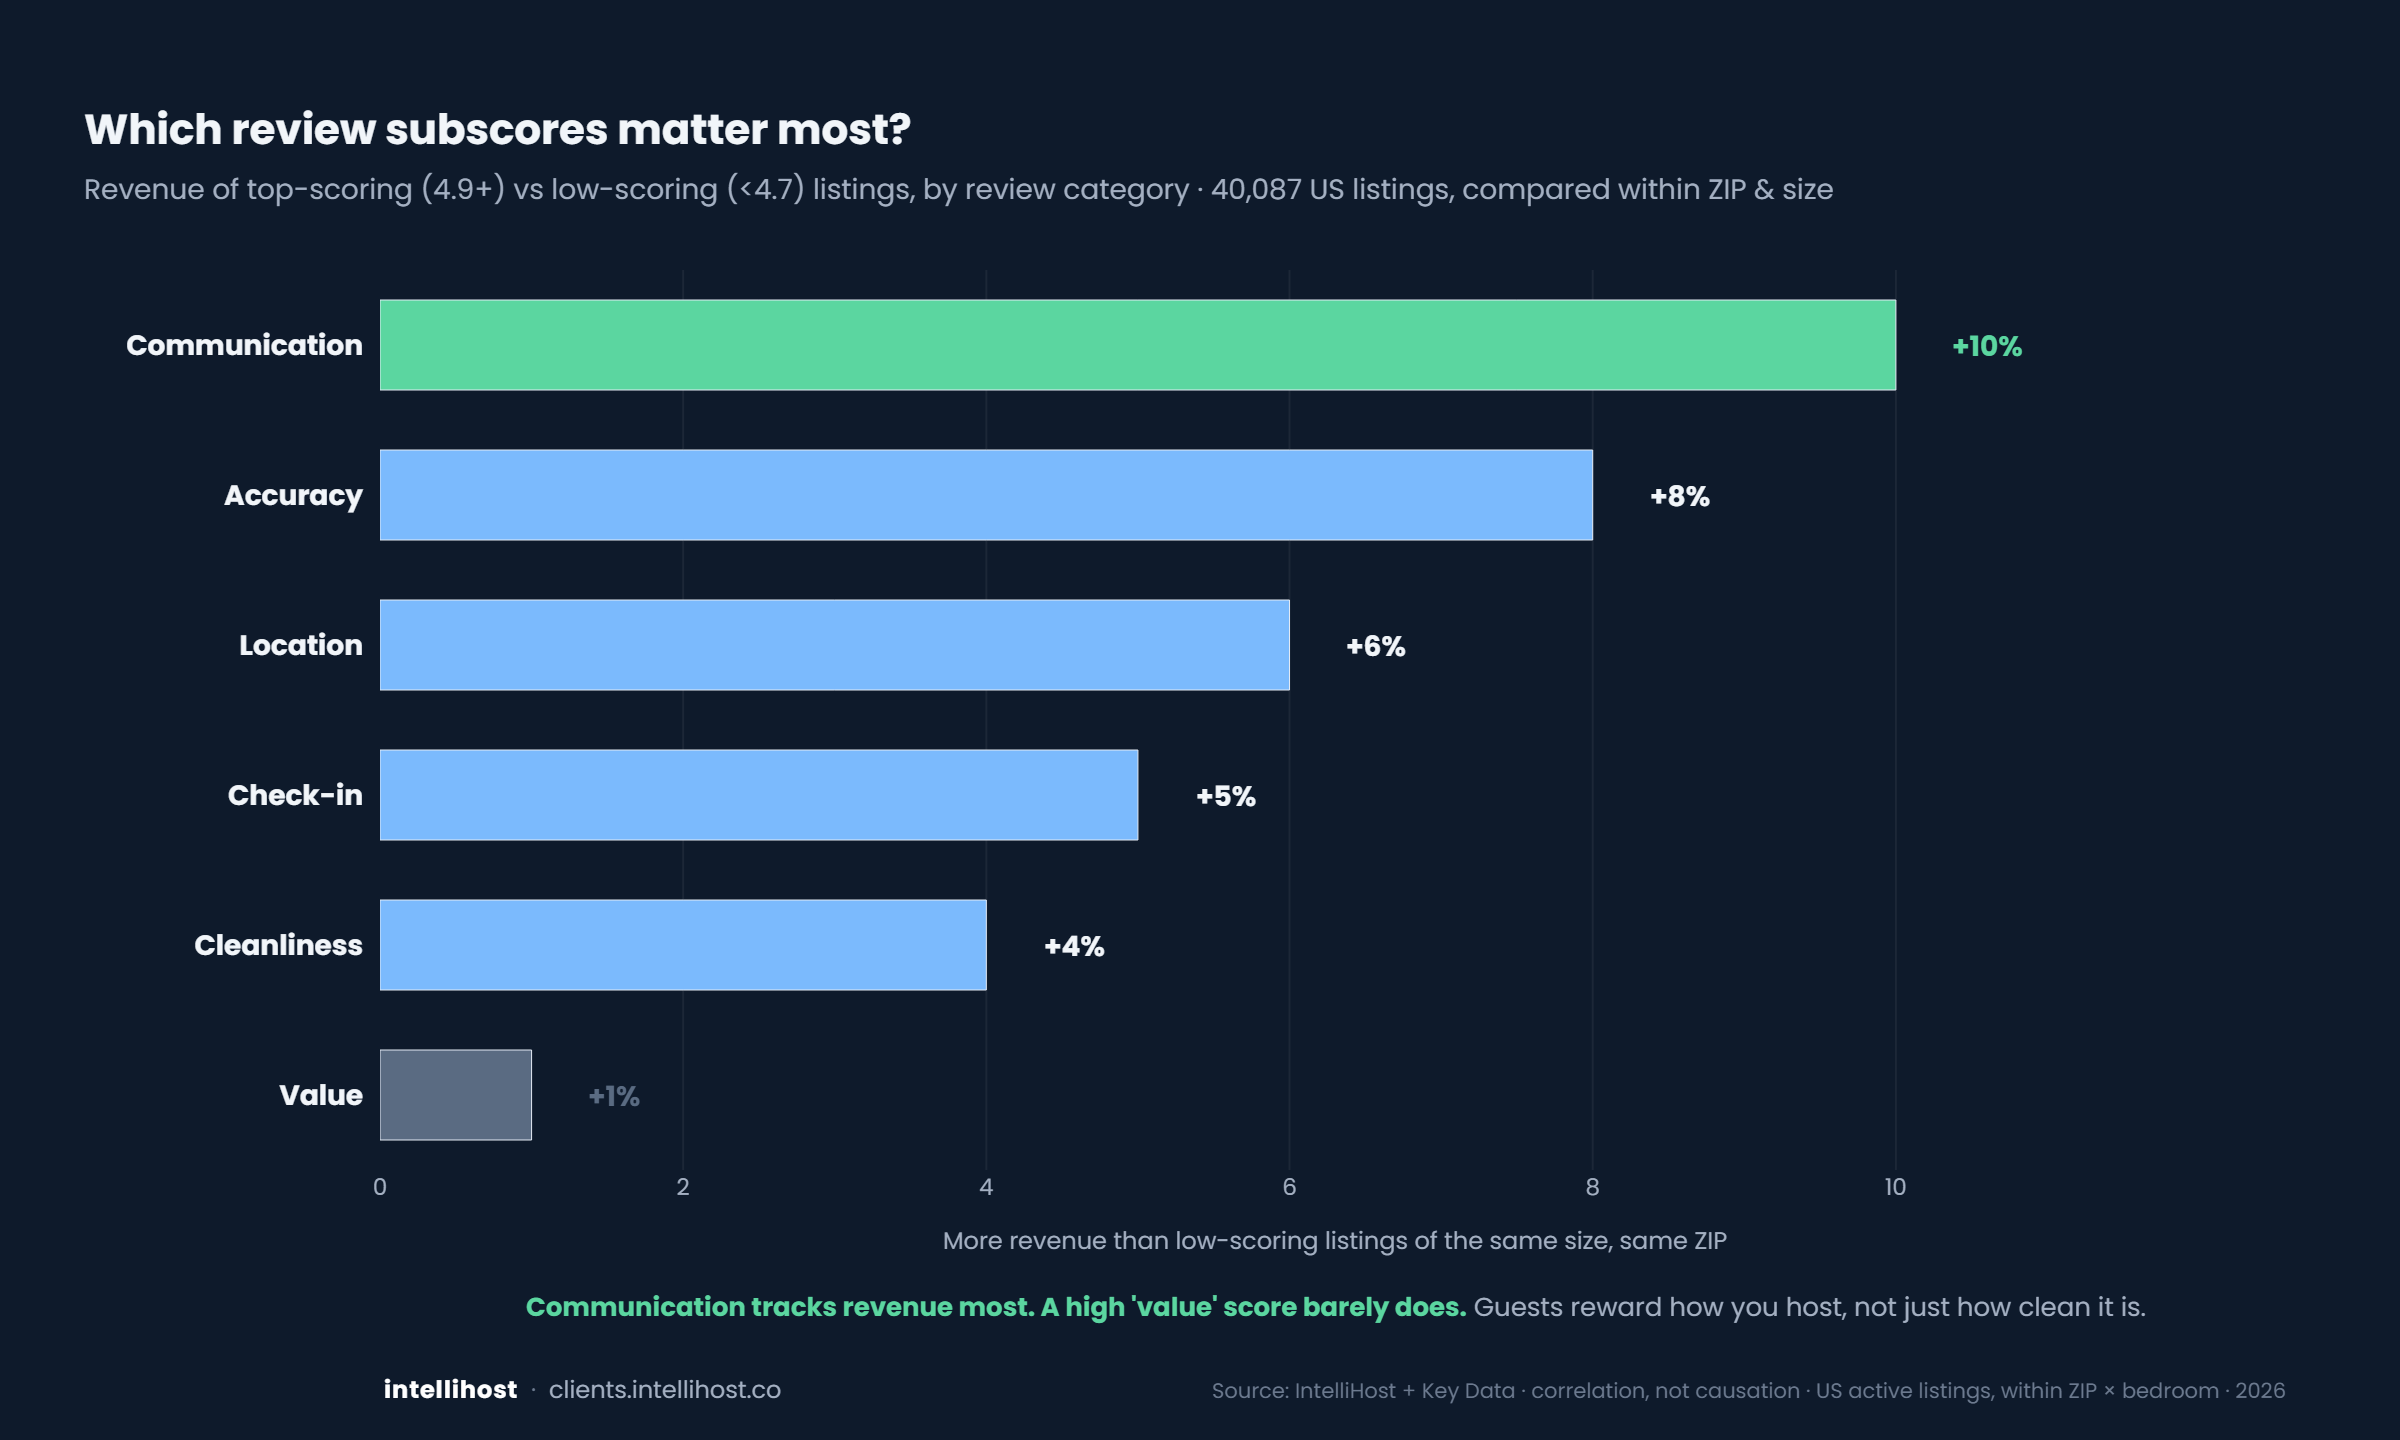
Which review subscore actually tracks revenue?
It isn't the one you scrub for.
Pricing
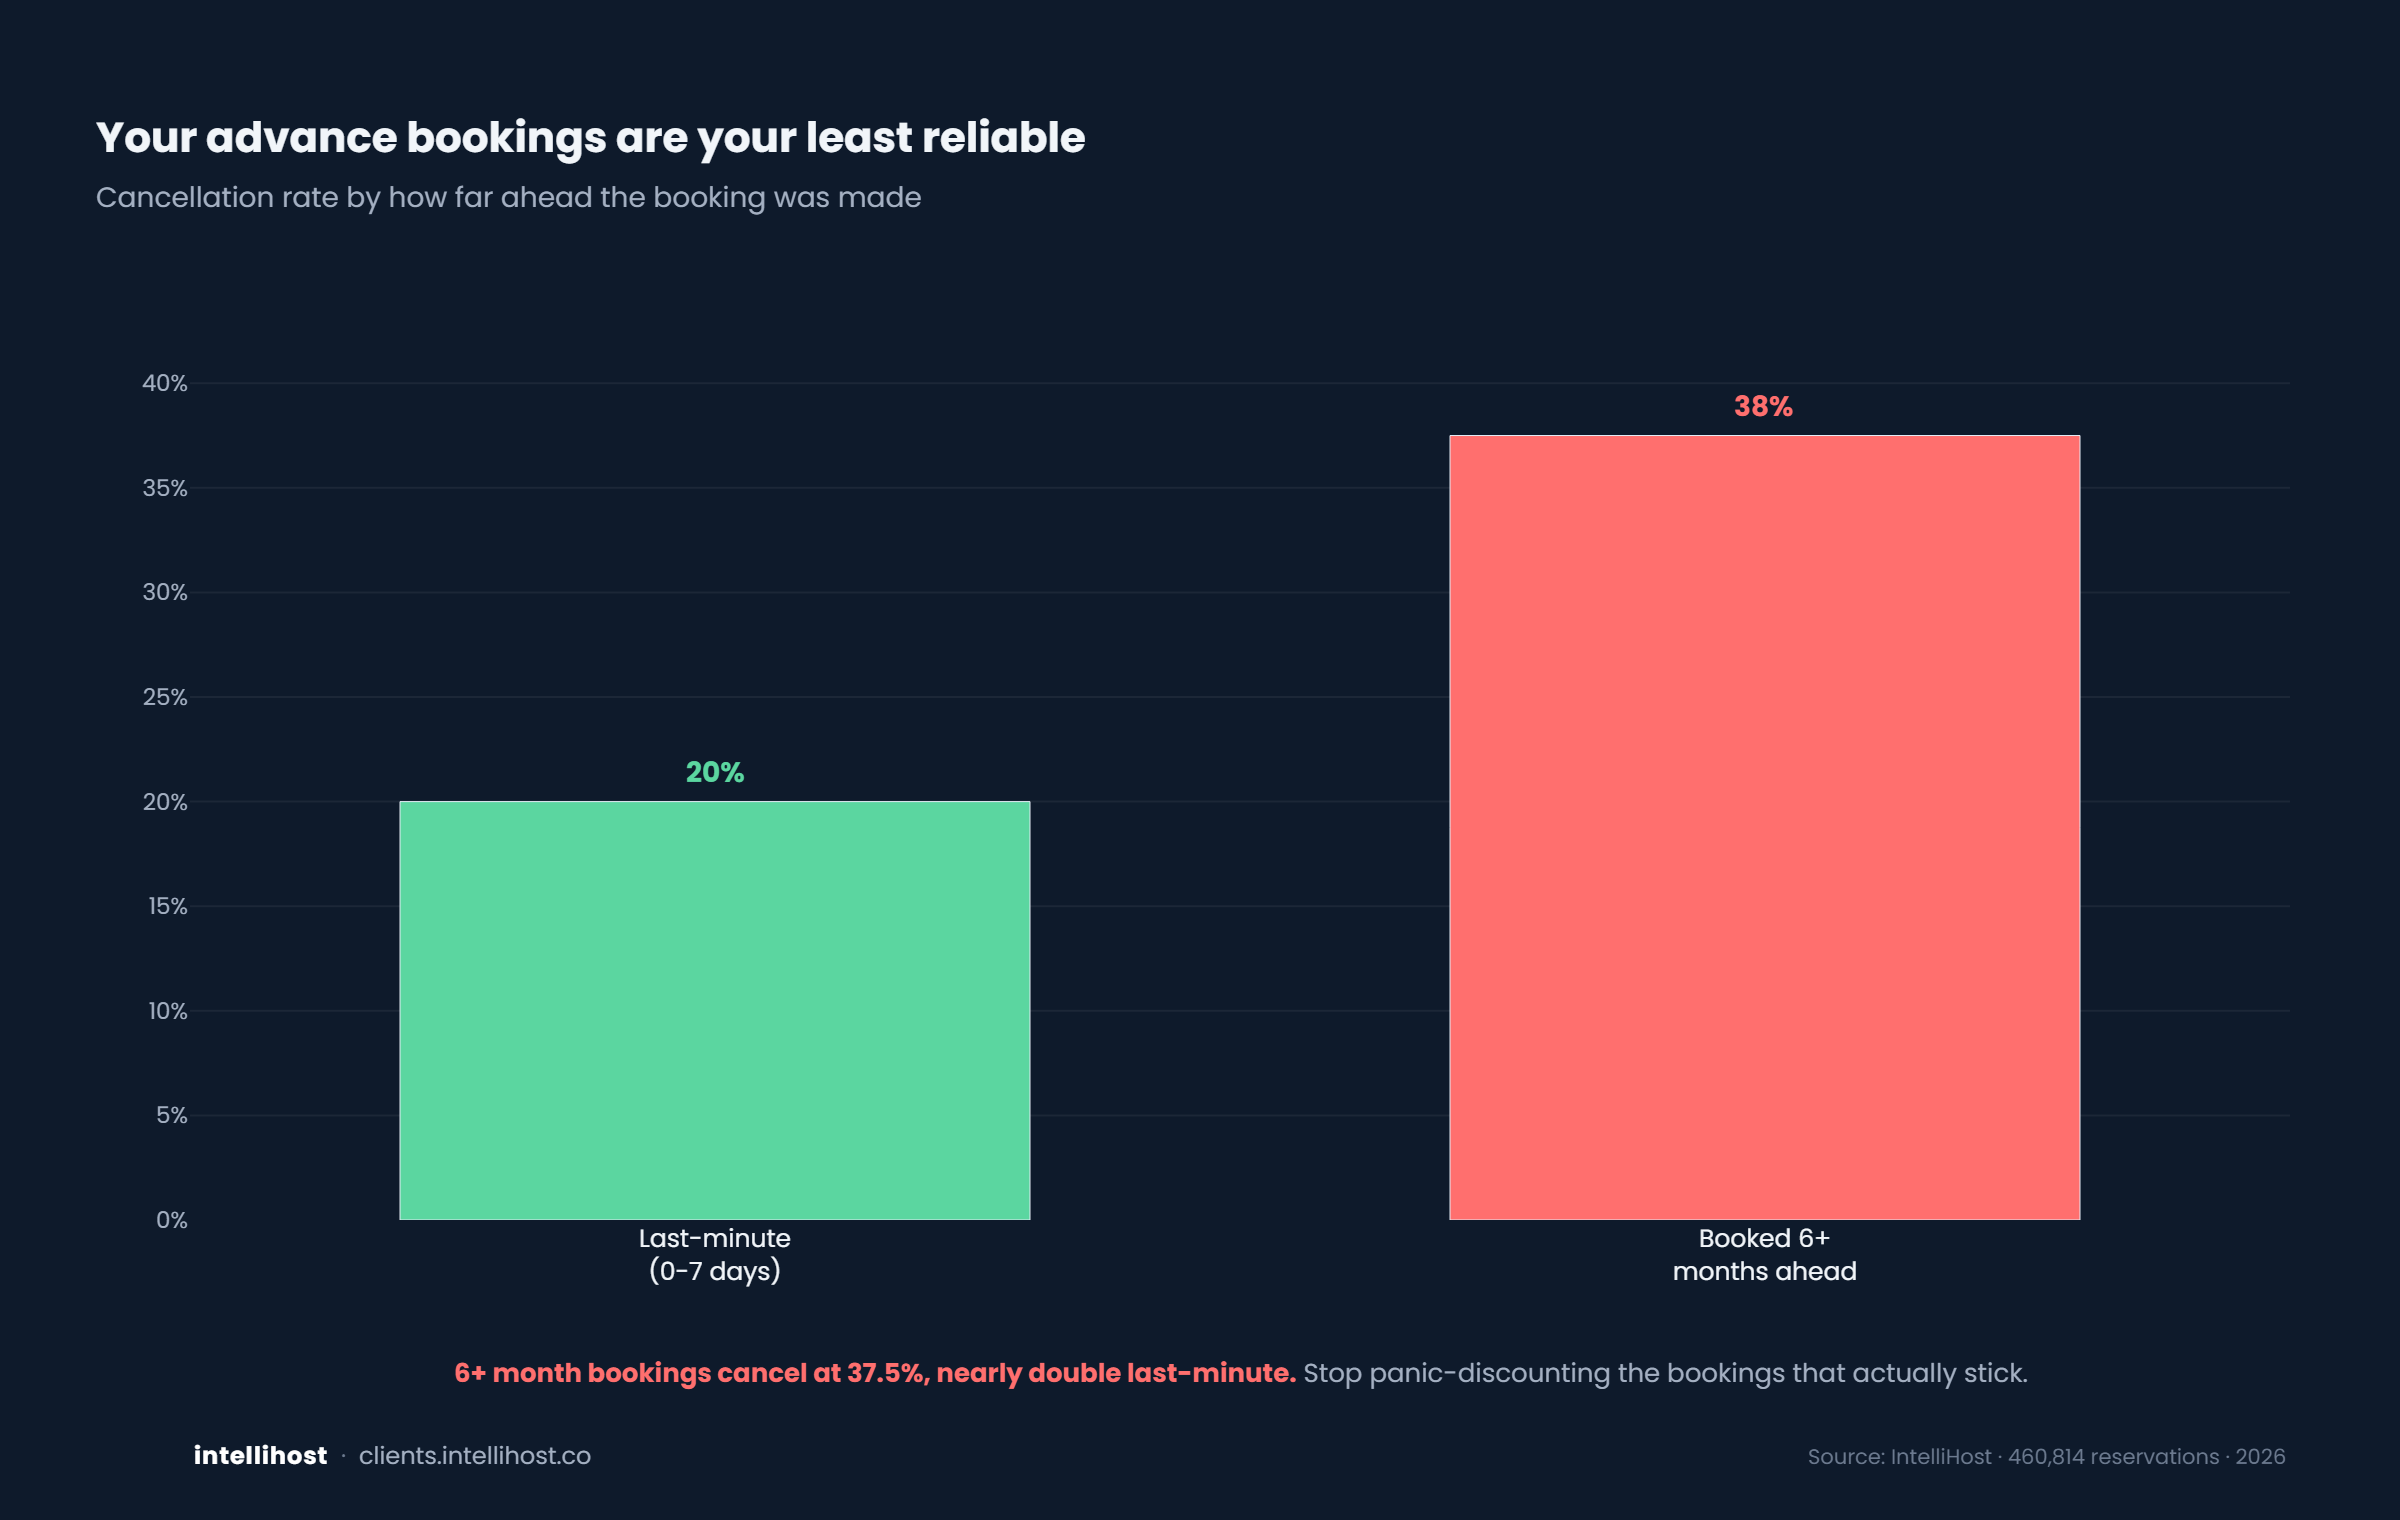
Your advance bookings are your least reliable
Stop panic-discounting the last-minute ones.
Listing craft
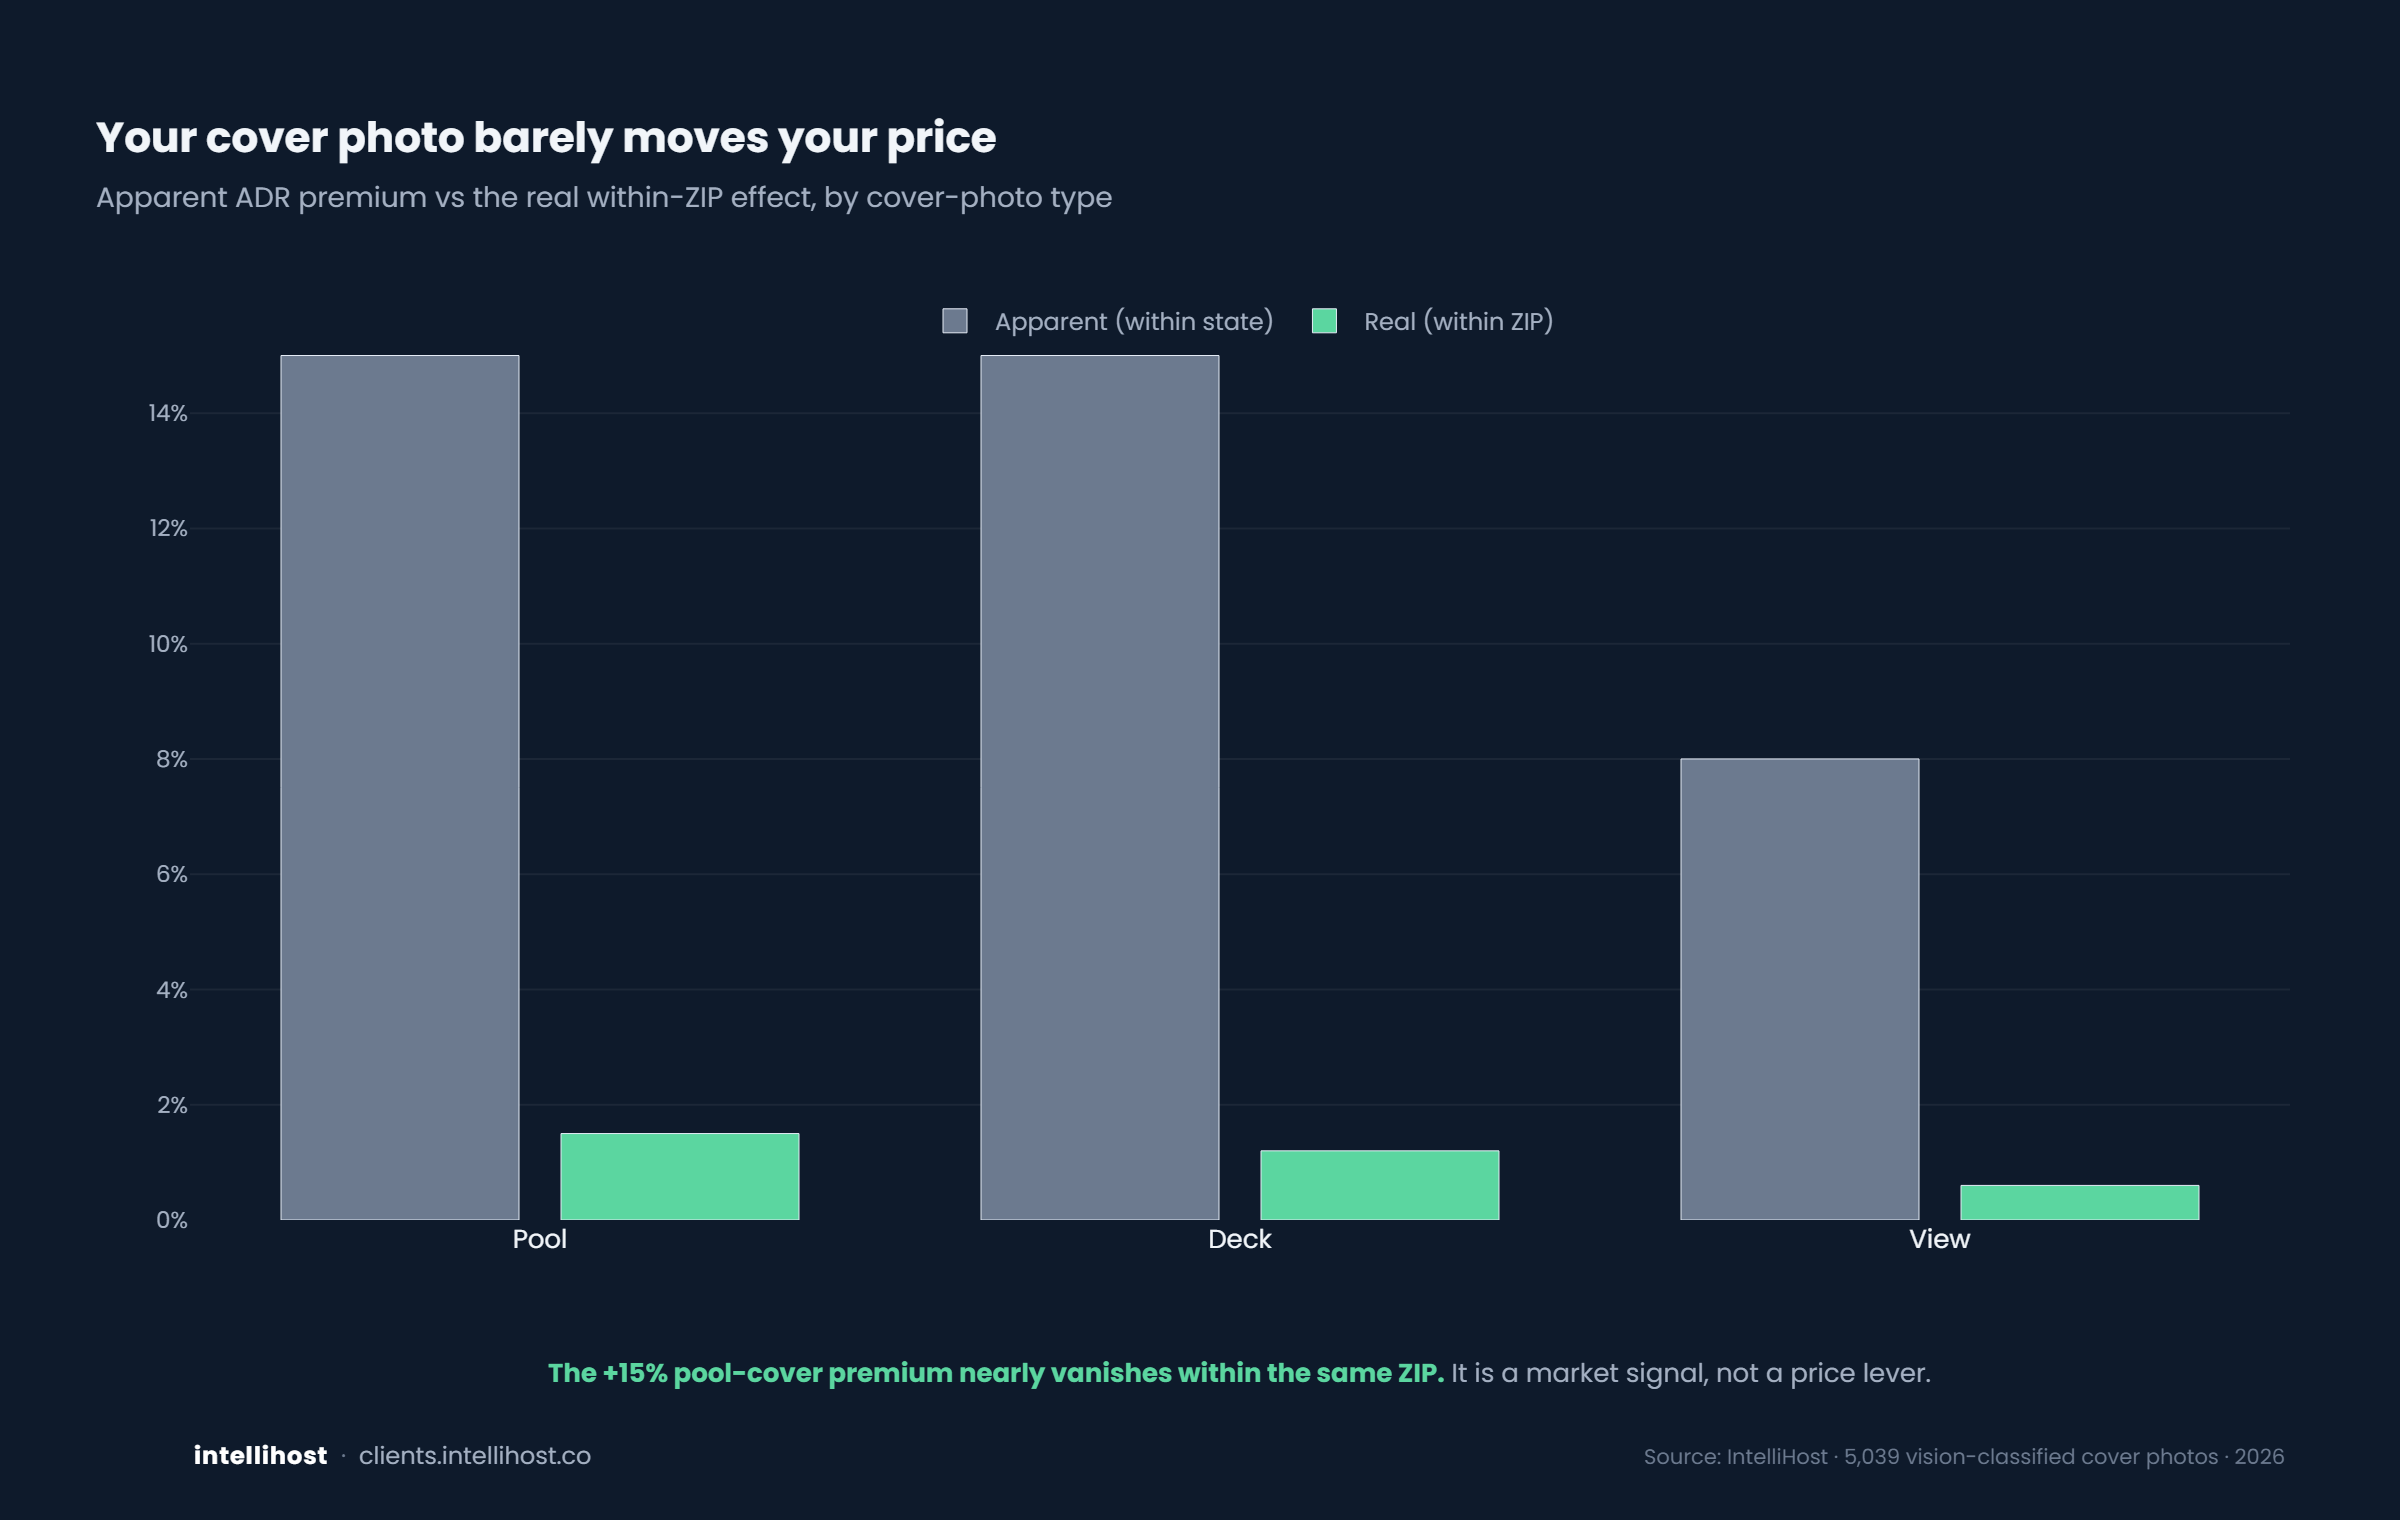
Your cover photo barely moves your price
It's a market signal, not a lever.